COGNITION360 REPORTING
NEW REPORT VIEWS
Cognition360 is a powerful Data Warehouse and Business Analytics platform that transforms ConnectWise data into actionable insights which are consistently delivering as much as a 30 percent increase in profitability for our customers – some have more than doubled their bottom-line profitability!
Cognition360 is a next generation business analytics solution available exclusively to ConnectWise customers. In sharp differentiation from competitors, this architecture supports machine learning and predictive AI analytics with the ability to drill down into interactive reports using live data to reveal why KPIs are off track, or uncover new ways to increase profitability and productivity.
Cognition360 includes the ability to quickly create your own customizable reports and analytics, without writing SQL queries, and all are automatically updated for ConnectWise versions and updates. Cognition360 is unique in that it goes beyond existing dashboard and reporting products, and can be implemented as a complementary rather than a competing business analytics solution.
With Cognition360 reporting, you have access to over 130 standard interactive self-service customizable report views and analytics. See an overview of our latest reporting views below.
July 2022
Agreement Profitability and Customer Profitability Reporting: Updates
See below sample screenshots and notes from our Agreement Profitability and Customer Profitability Reports. Click on any image for a full-size view.
Agreement Profitability Report
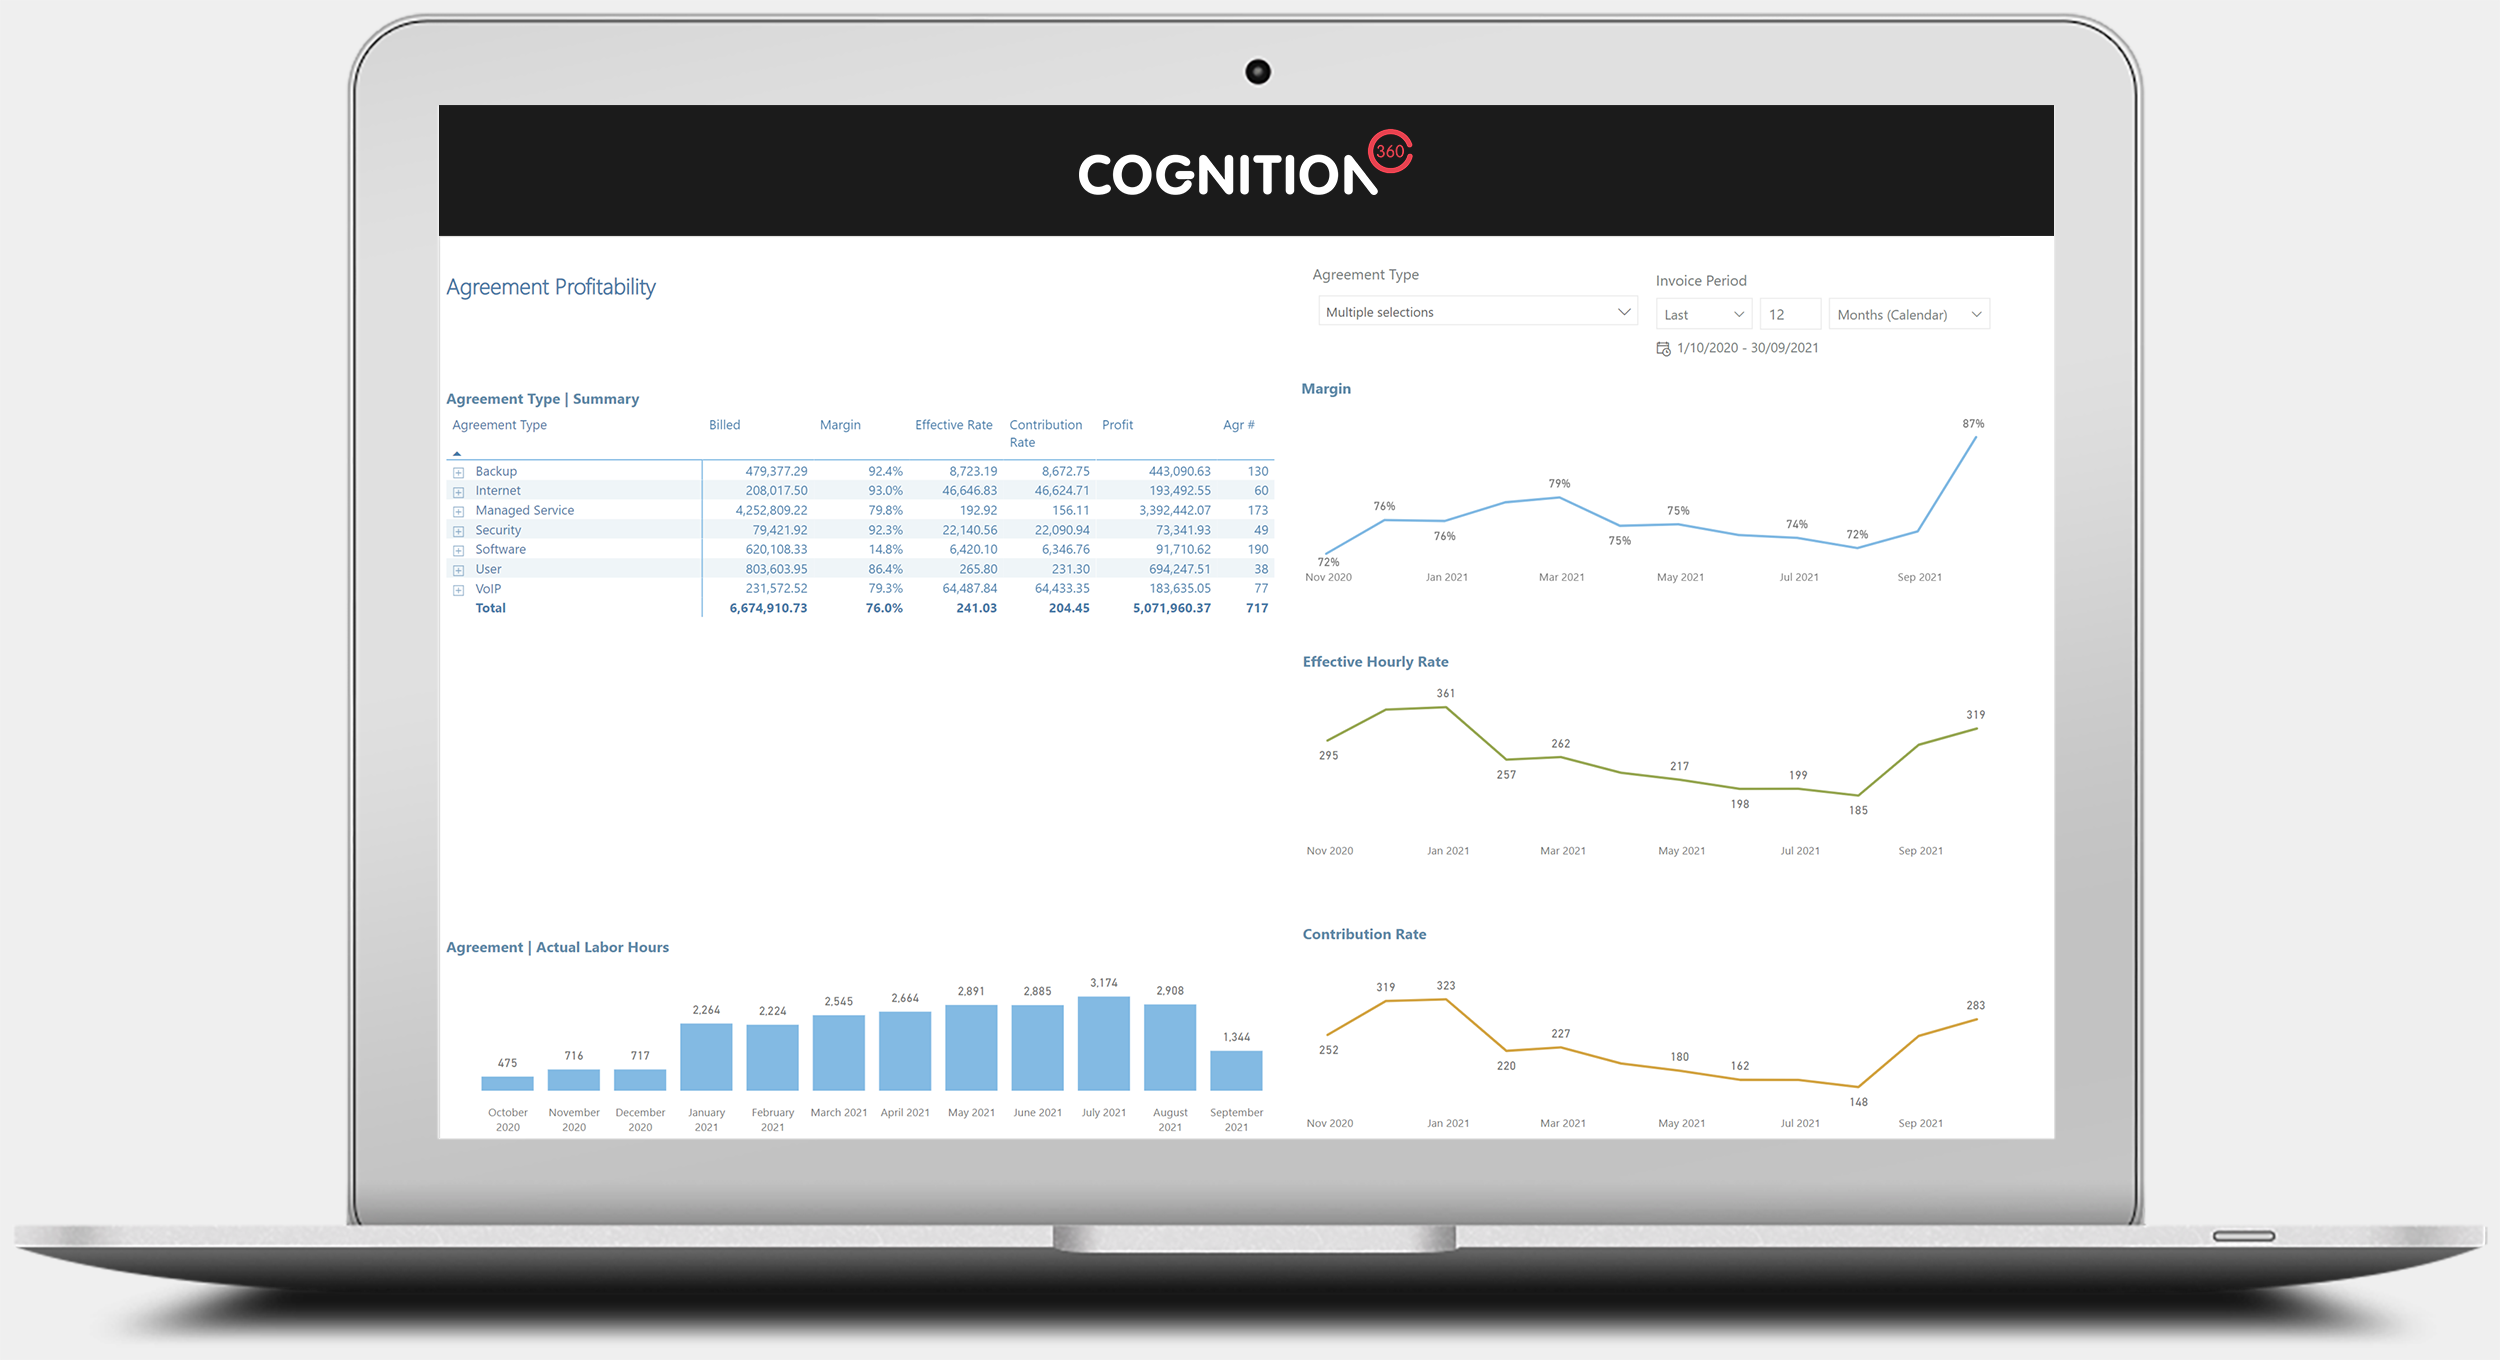
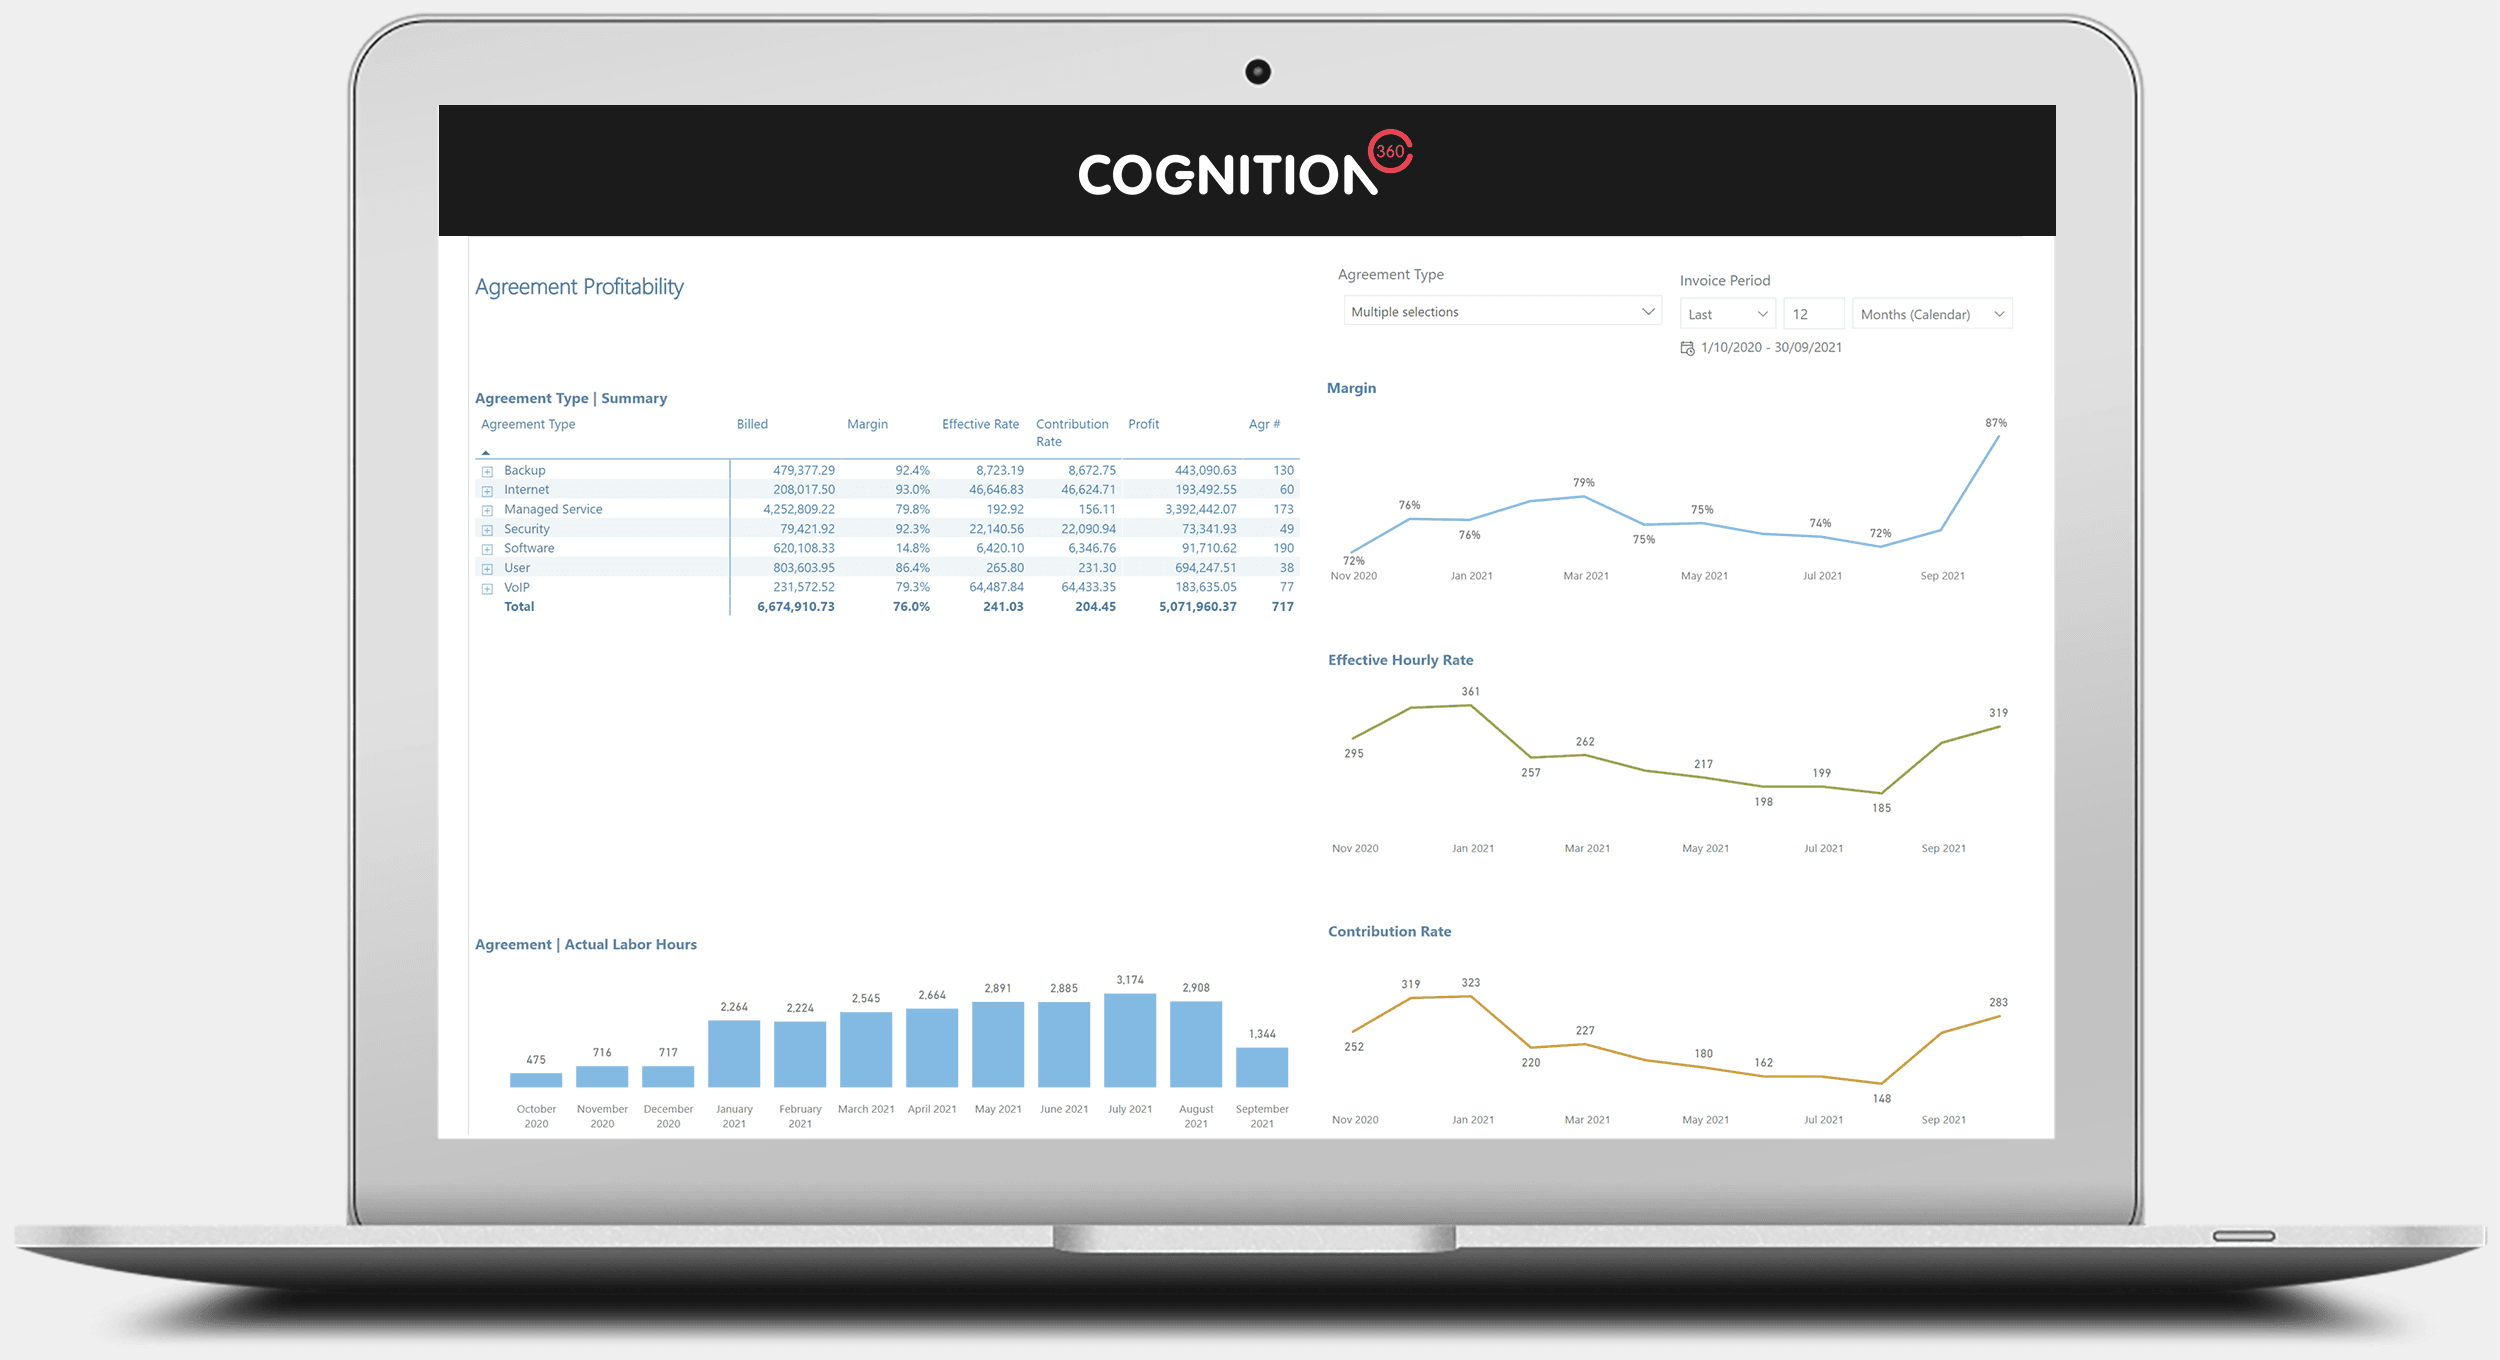
View Shown: Agreement Type | Summary
See agreement profitability by Agreement Type, with trending for Margin, Effective Rate, and Contribution Rate.
(Number of report views shown: 1)
Image too small? See full size image here
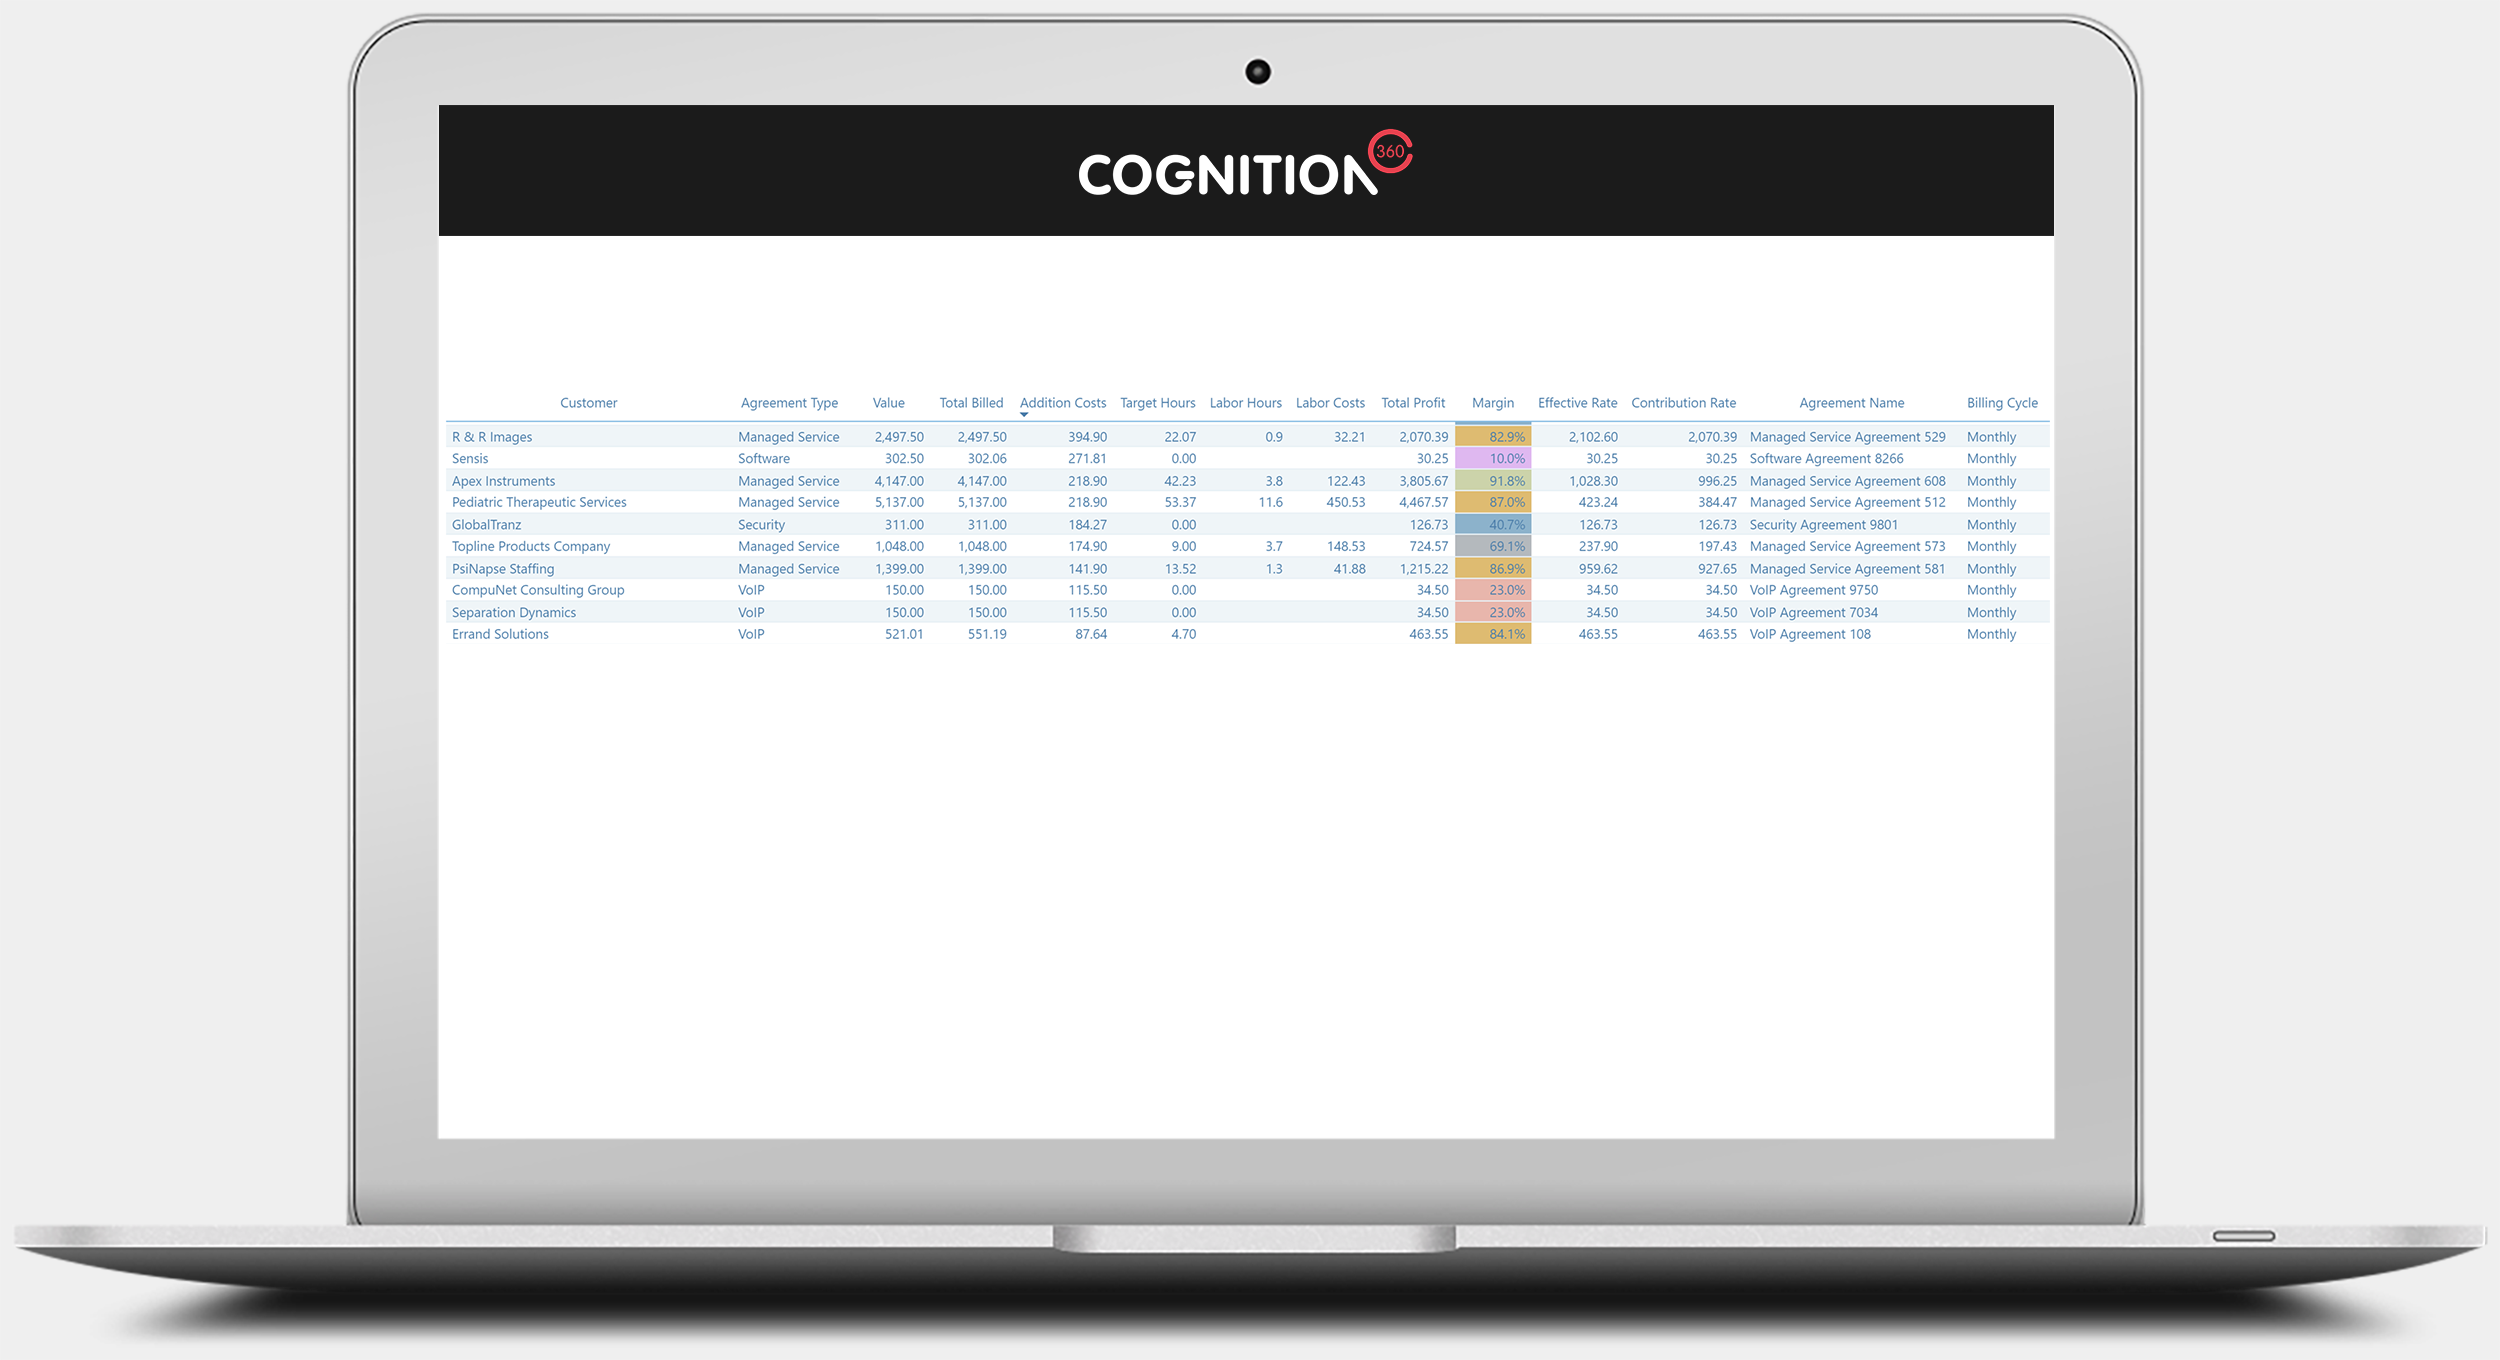
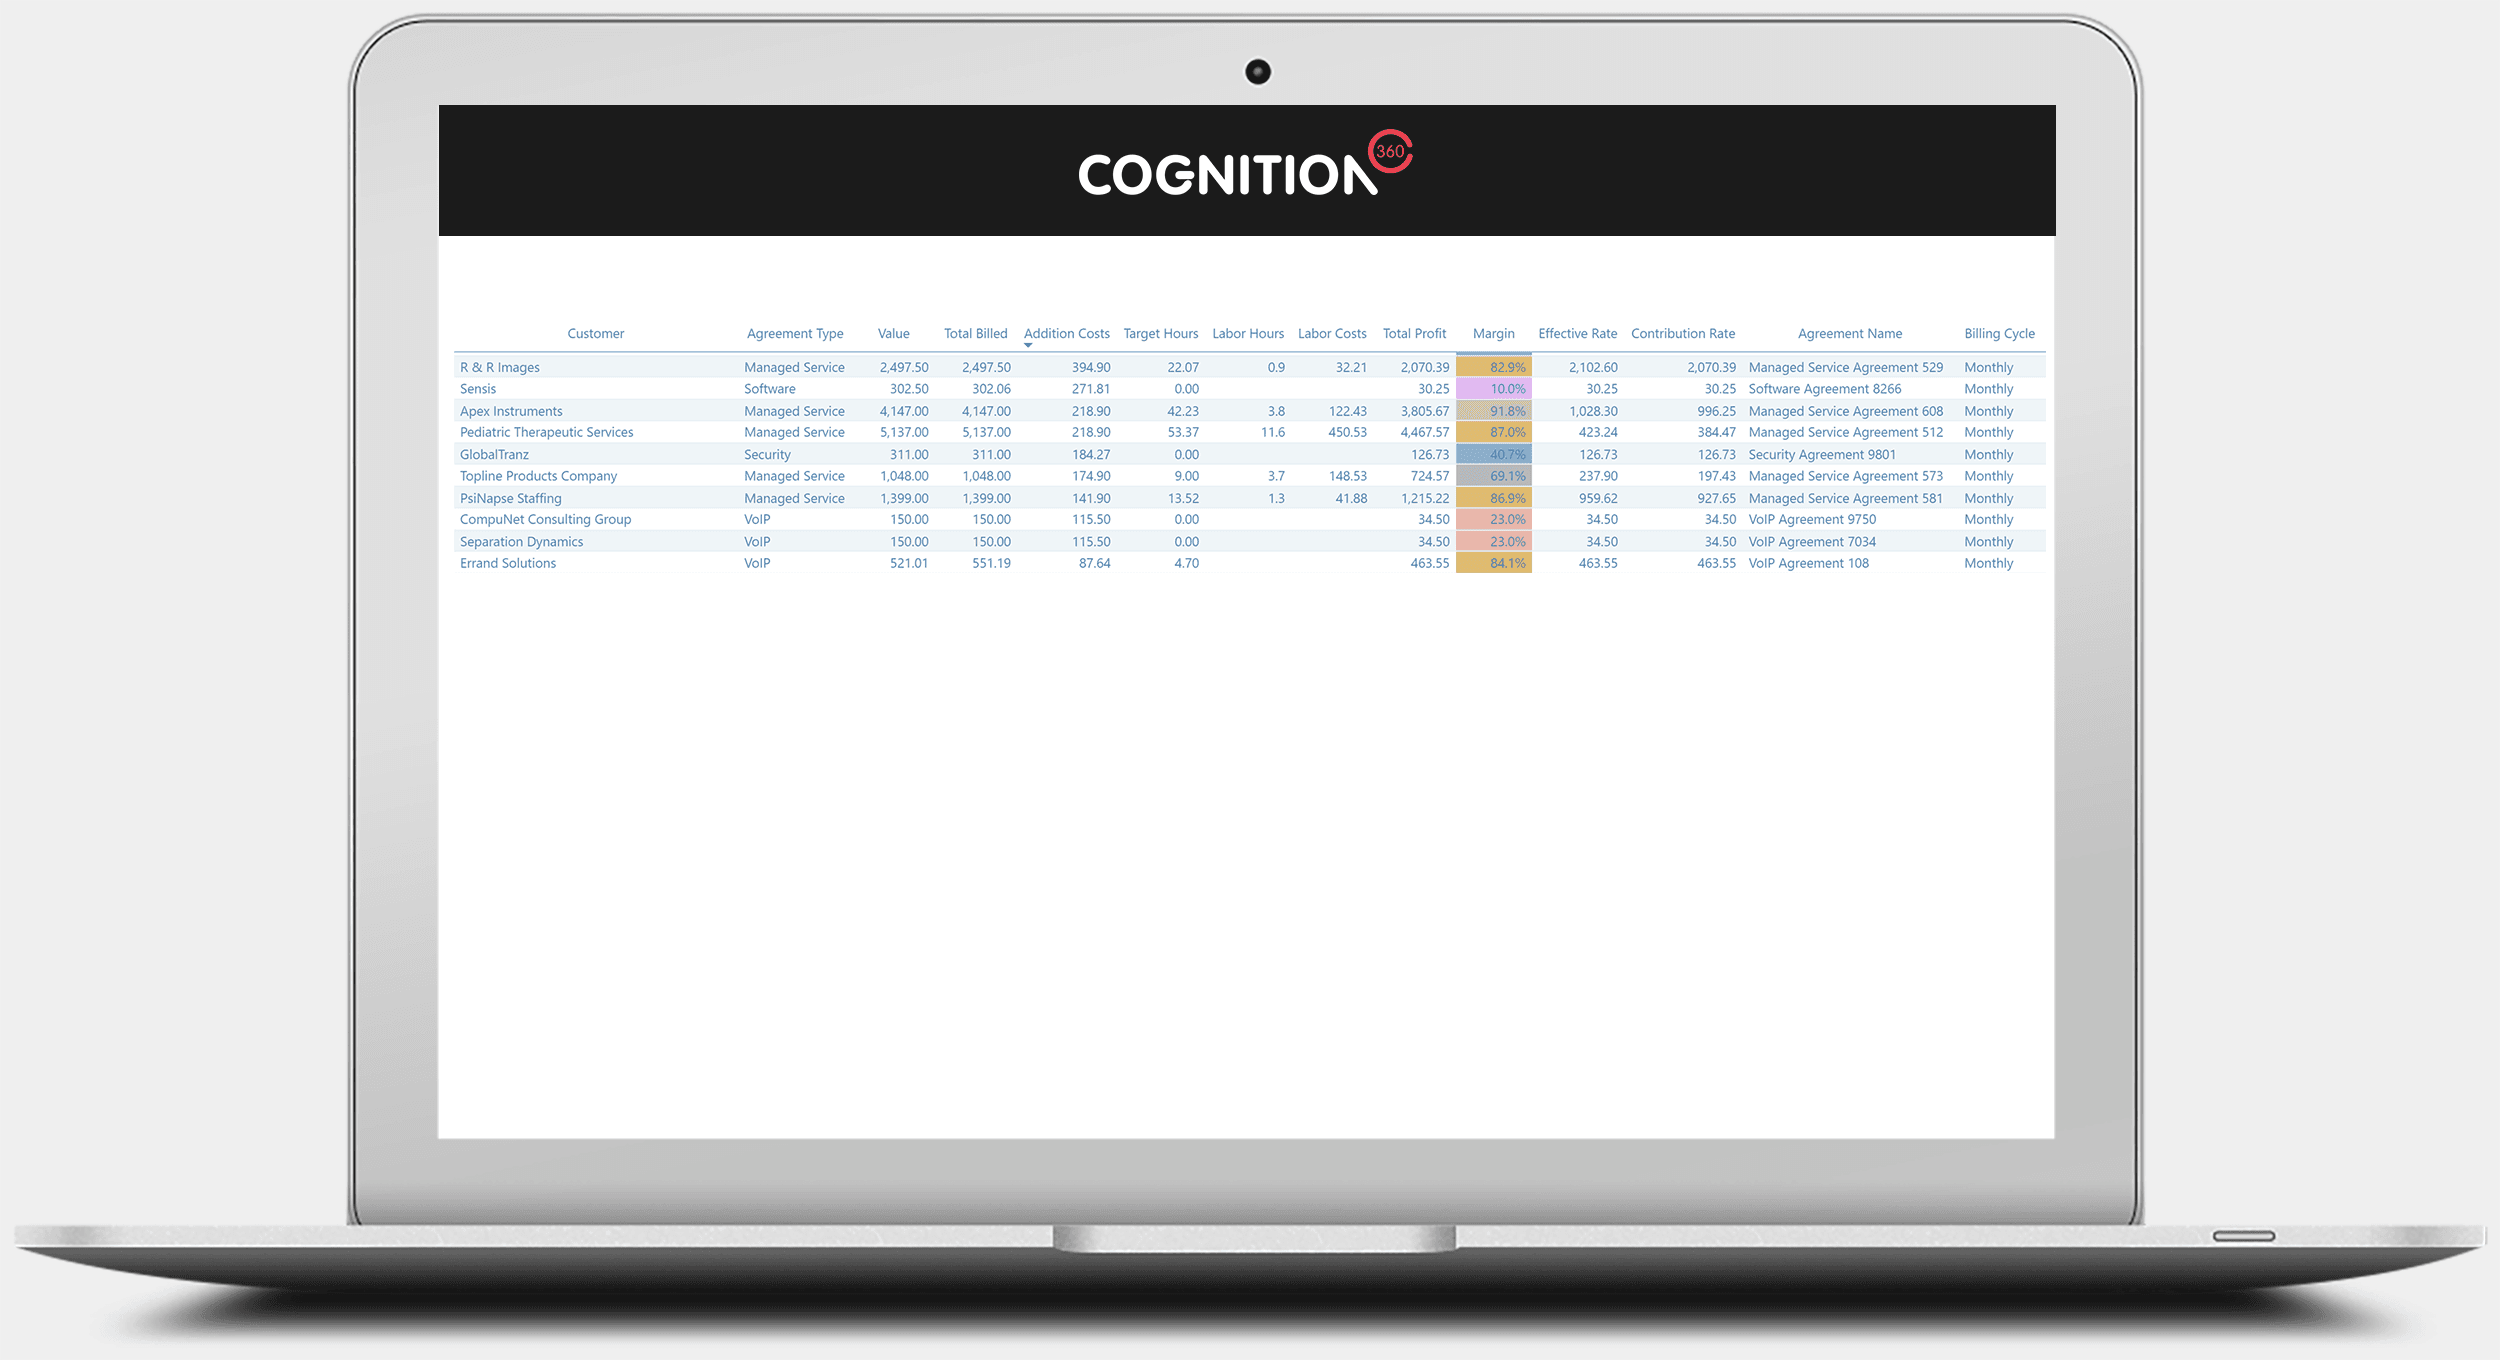
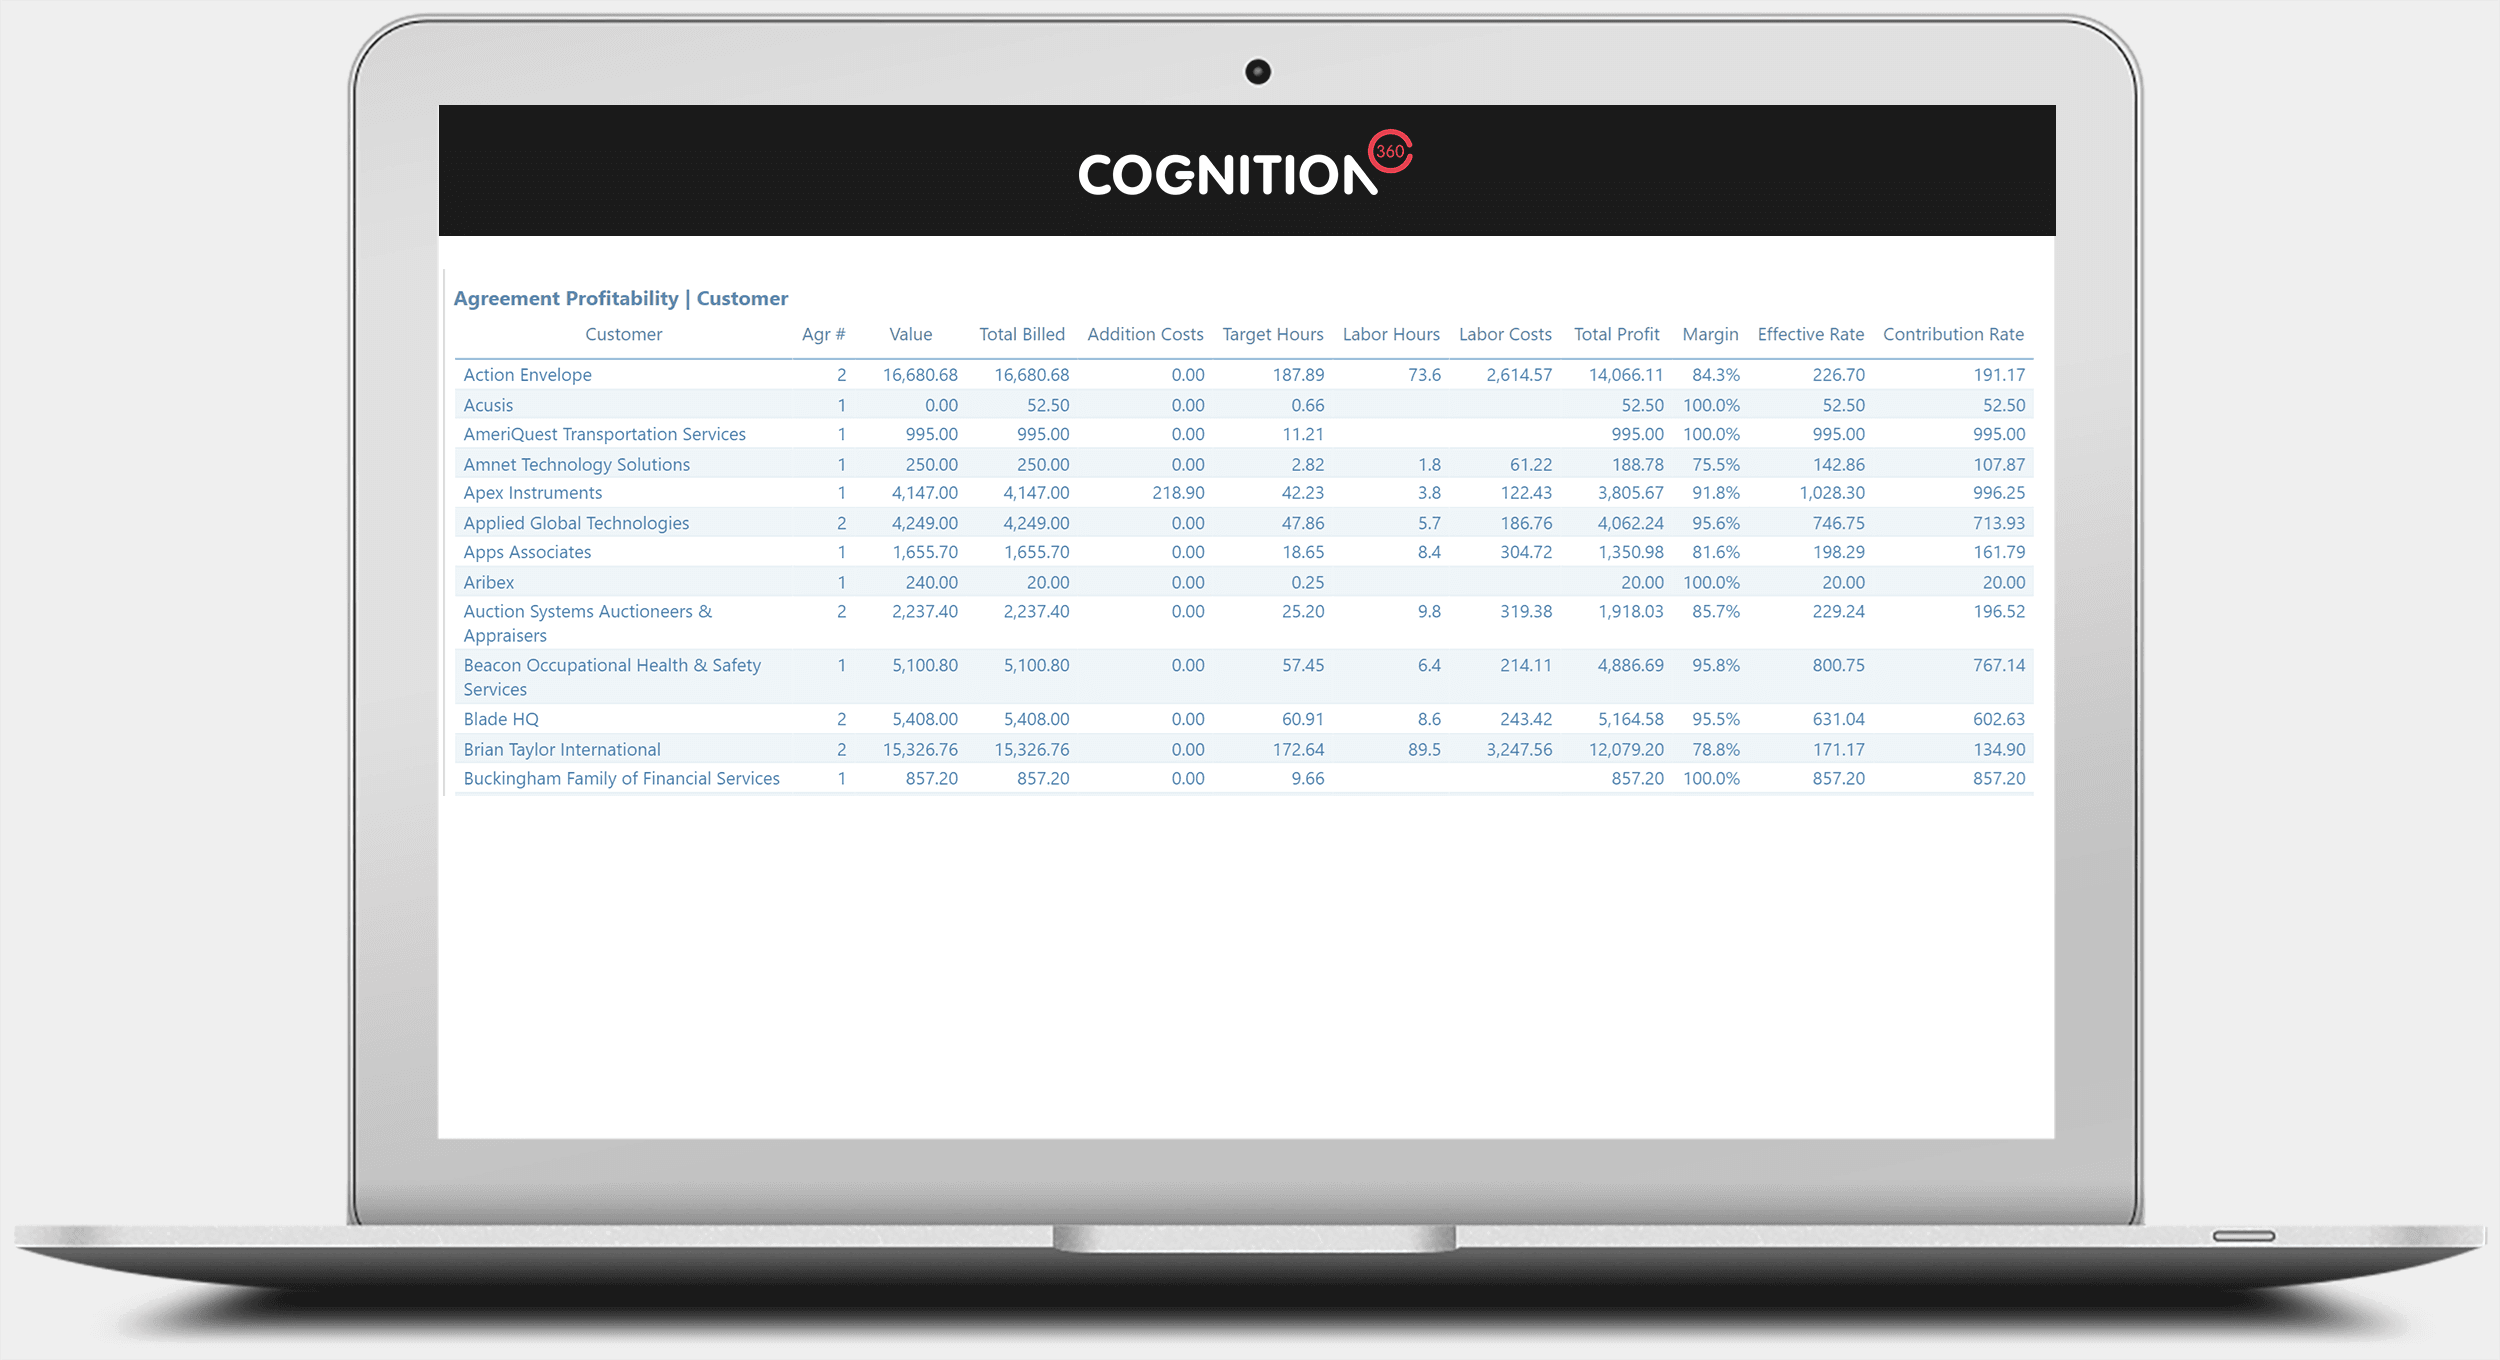
View Shown: Profitability Per Agreement
View profitability per agreement. Data for billing is shown at the agreement level. This allows profitability for each agreement to be shown even when the agreement is not the main agreement on the CW Manage invoice e.g., parent and child agreements will be shown separately.
(Number of report views shown: 1)
Image too small? See full size image here
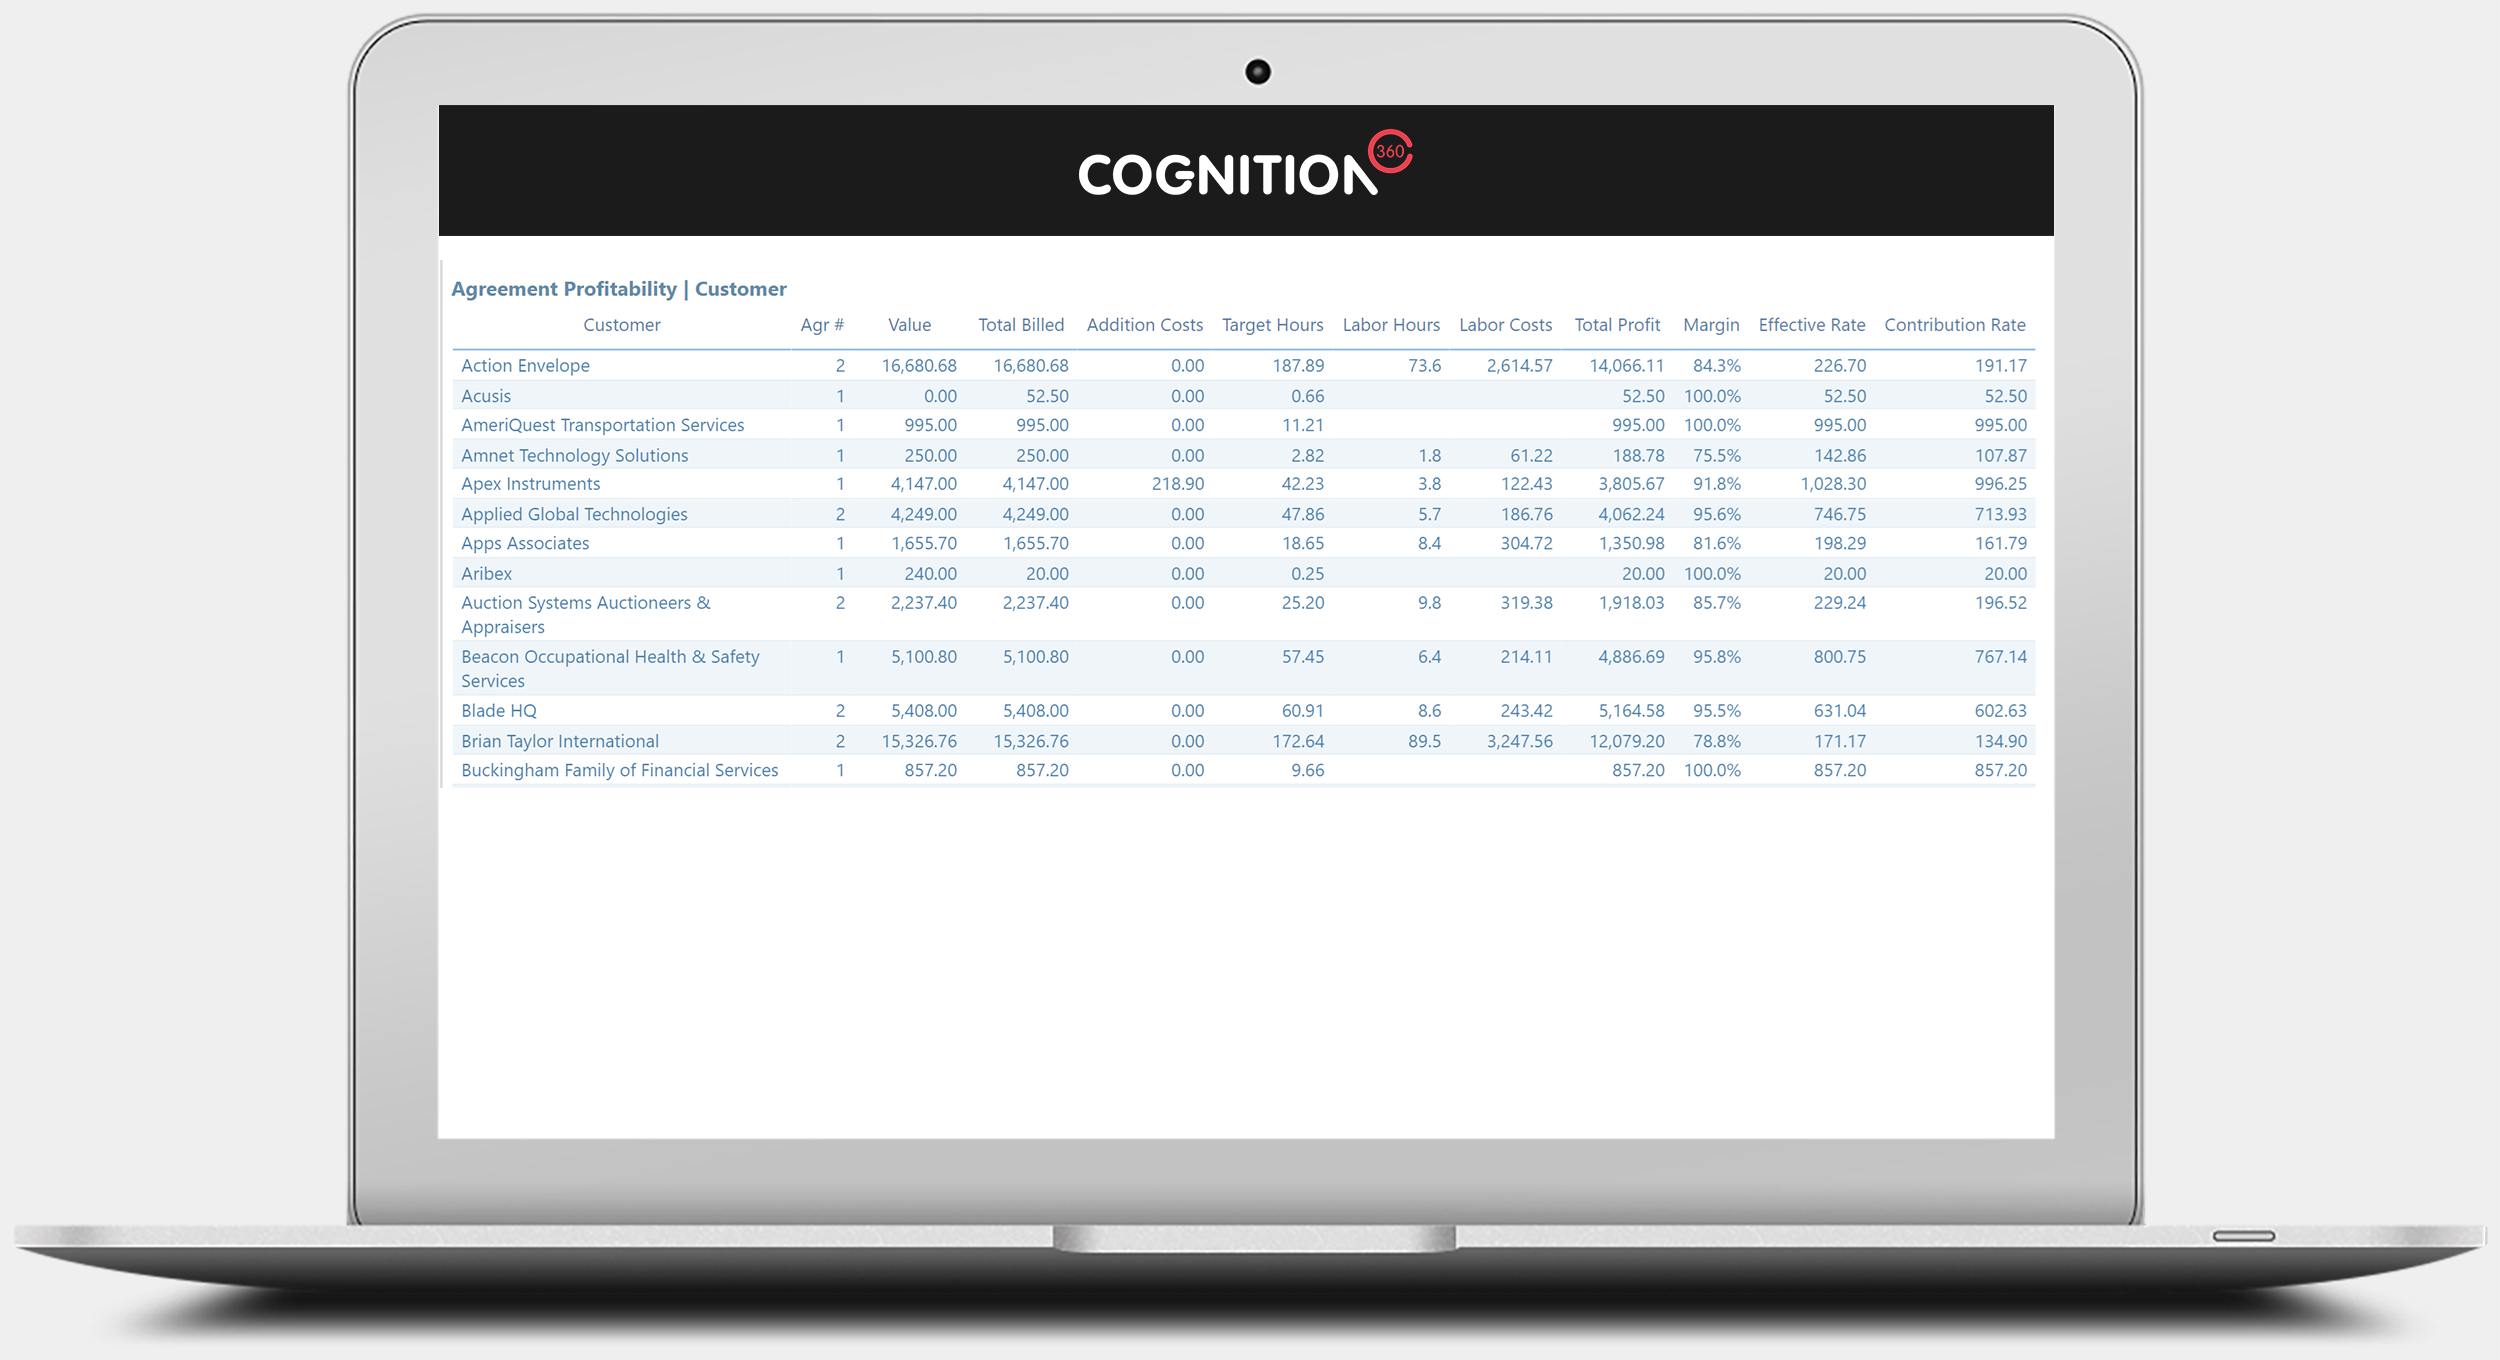
View Shown: All Customer Agreements
Alternatively, view all customer agreements together. This view allows for parent and child agreements to be rolled up into one profitability view.
(Number of report views shown: 1)
Image too small? See full size image here
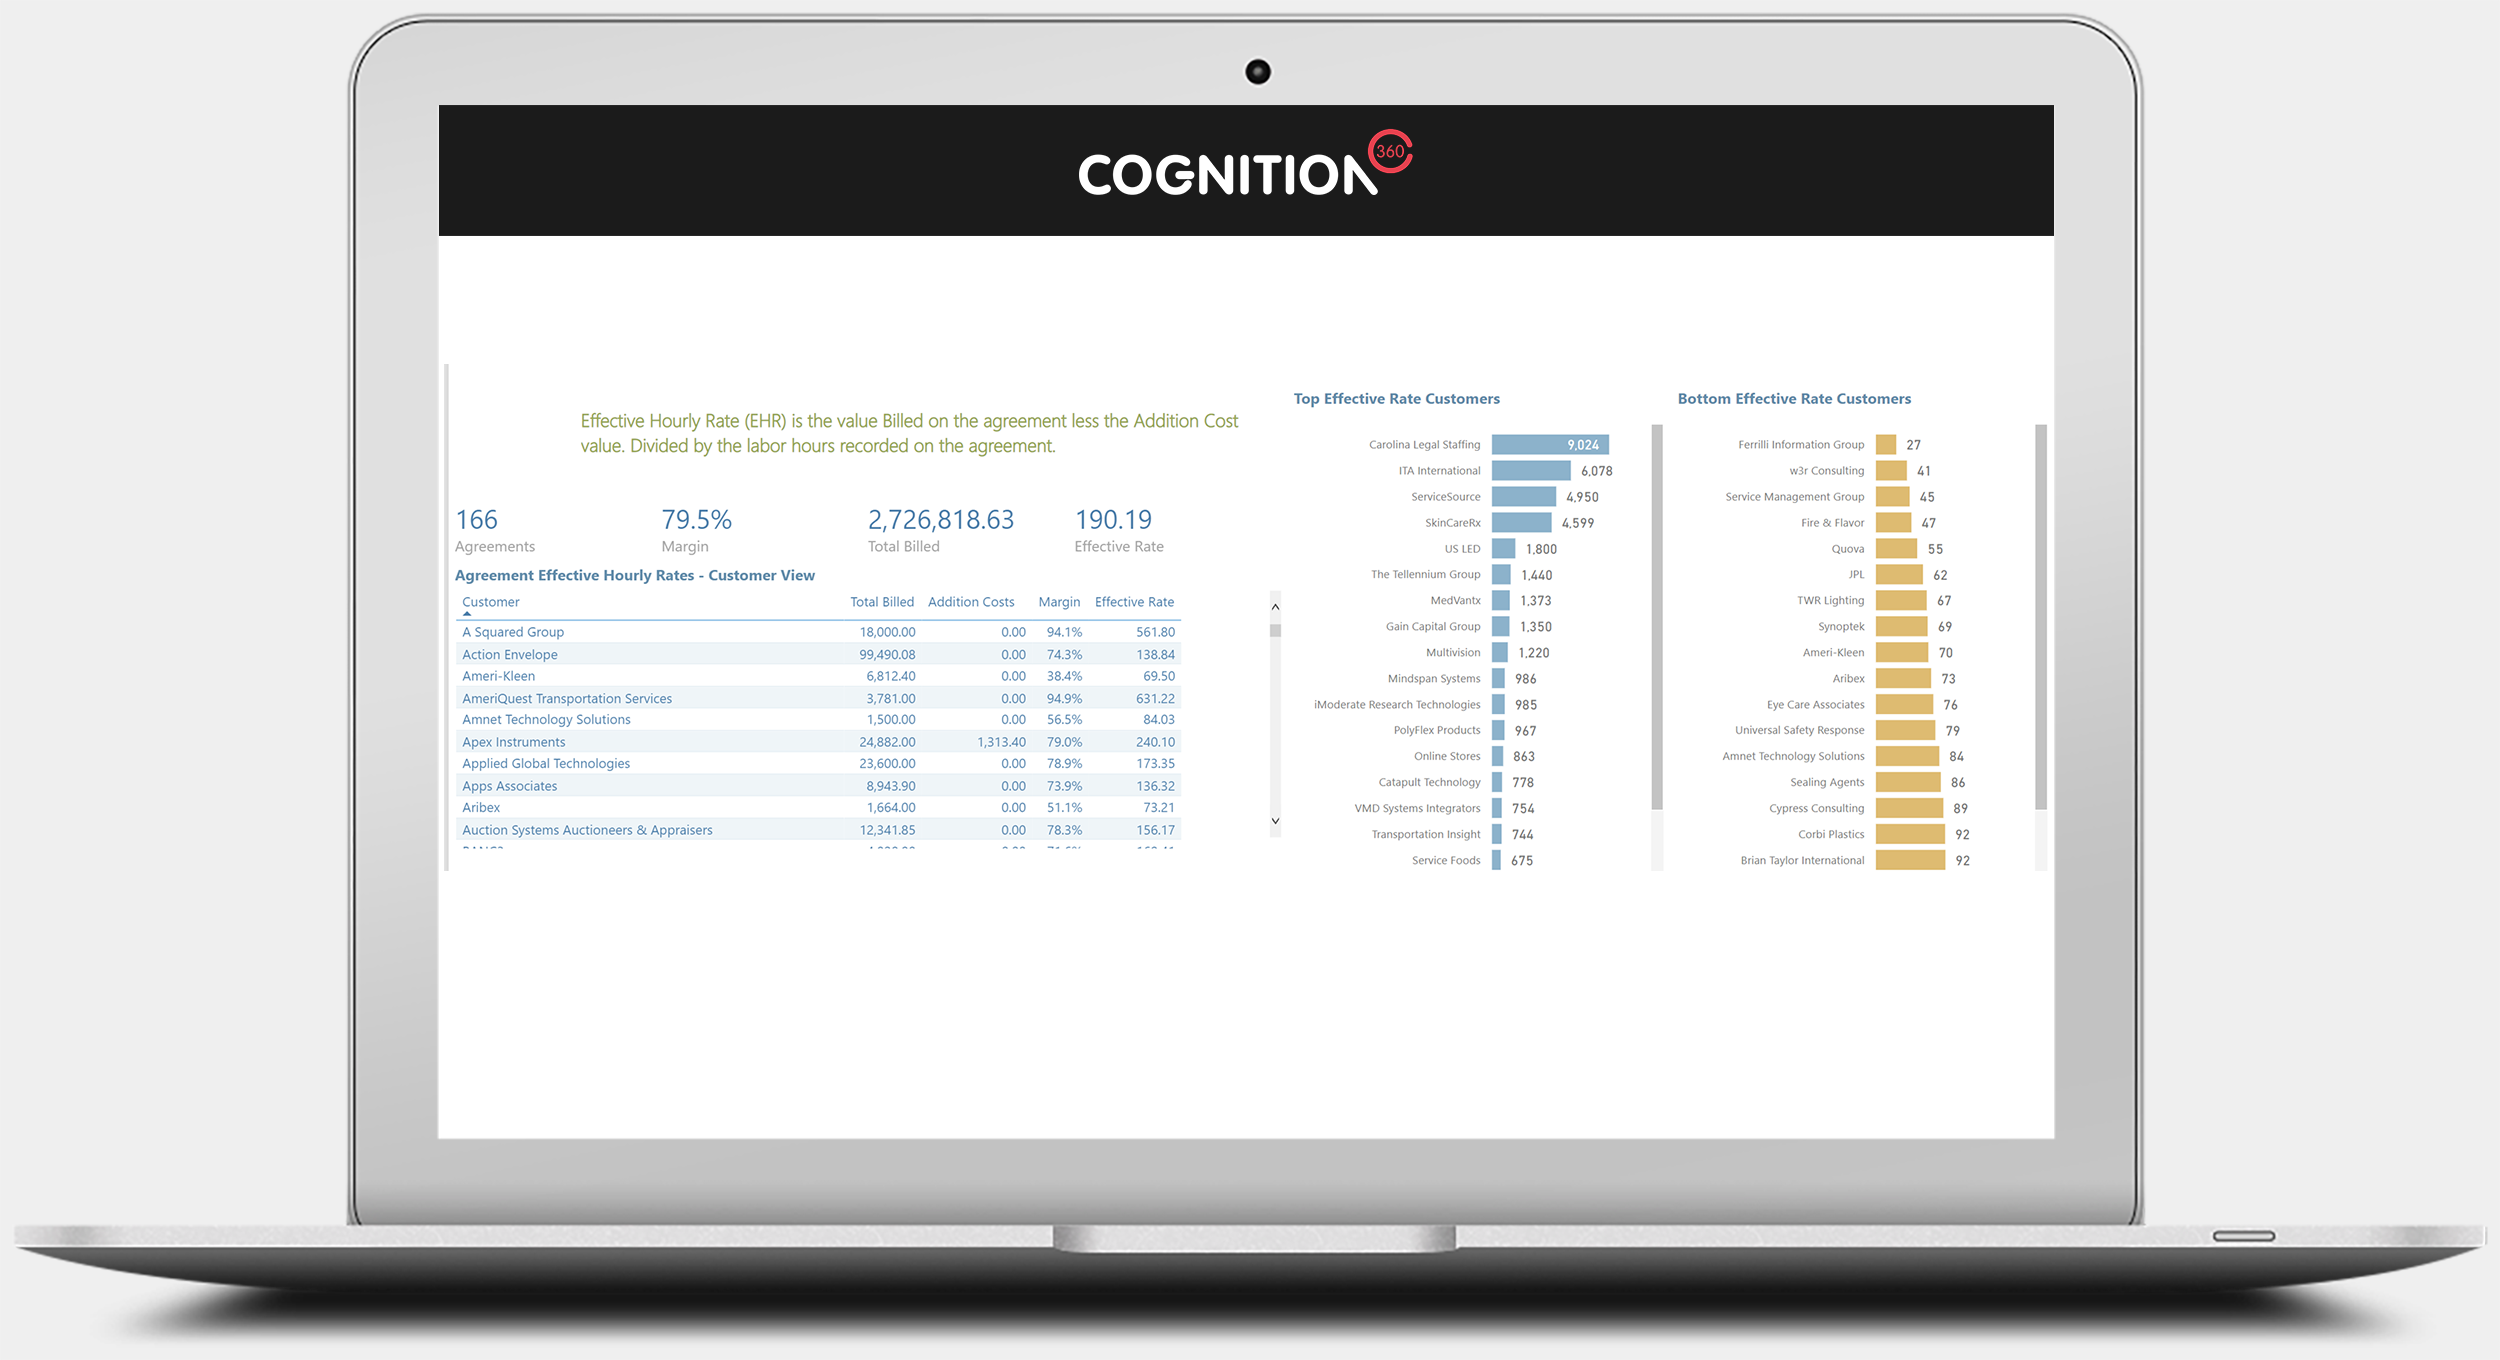
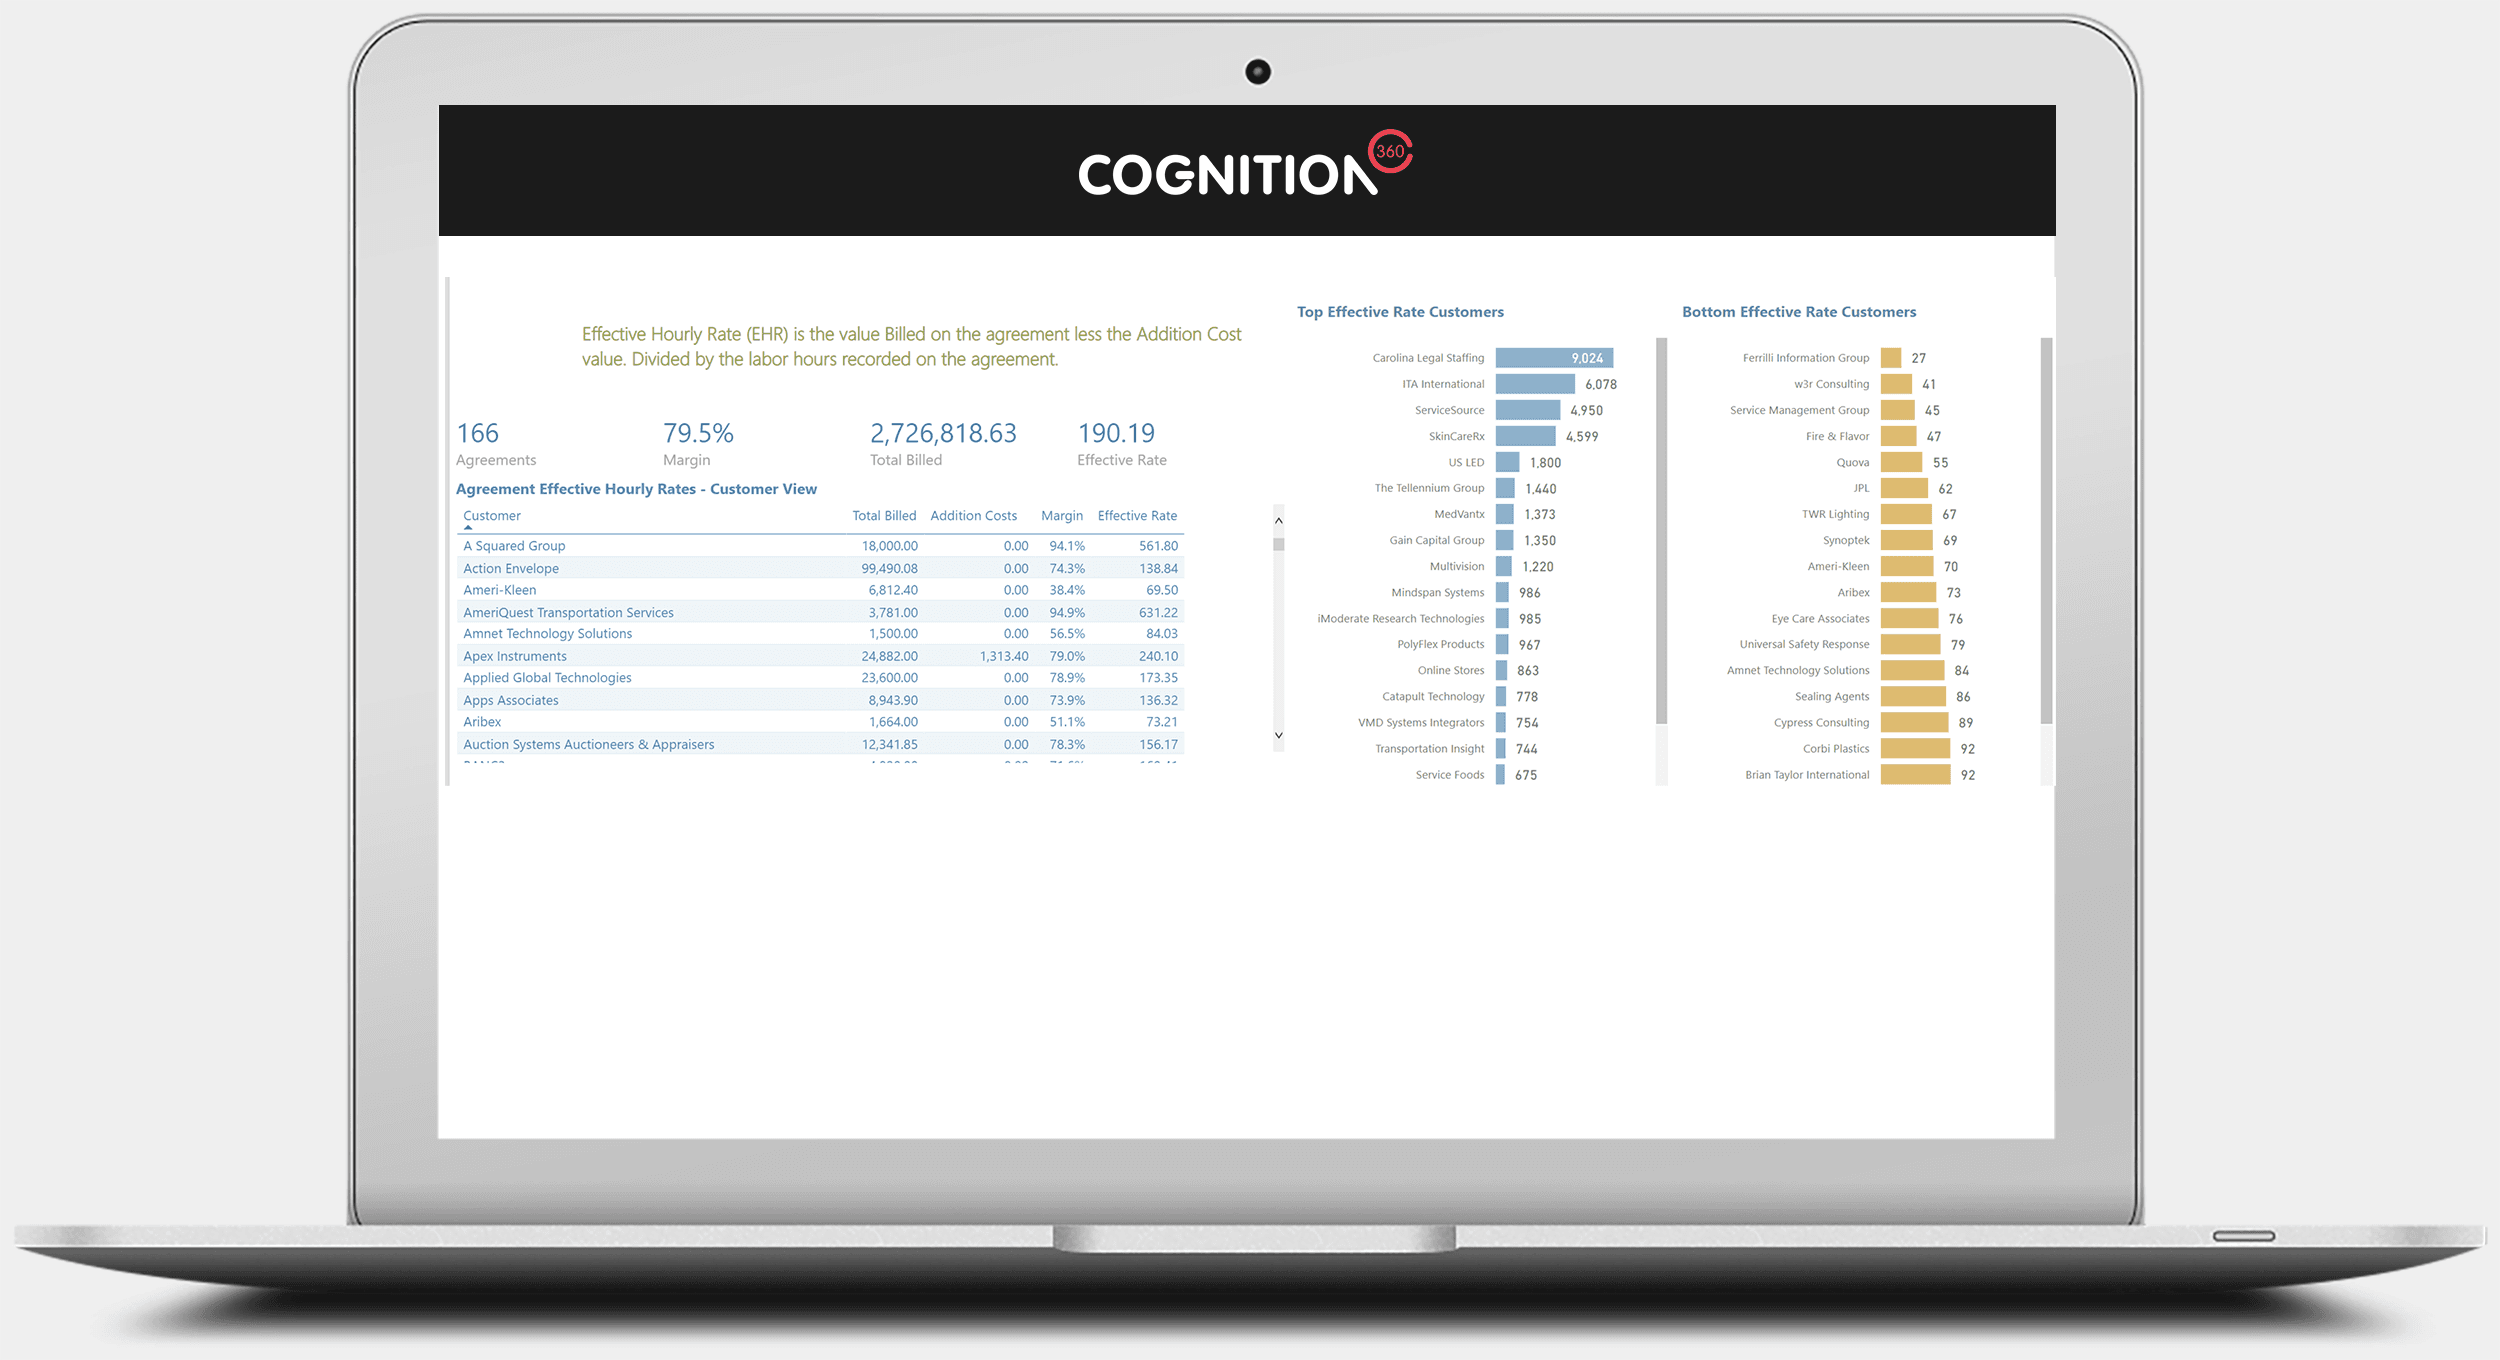
View Shown: Agreement Effective Hourly Rates
View Effective Hourly Rate for all, top segment, or bottom segment of agreements. A similar view is also available for Contribution Rate.
(Number of report views shown: 1)
Image too small? See full size image here
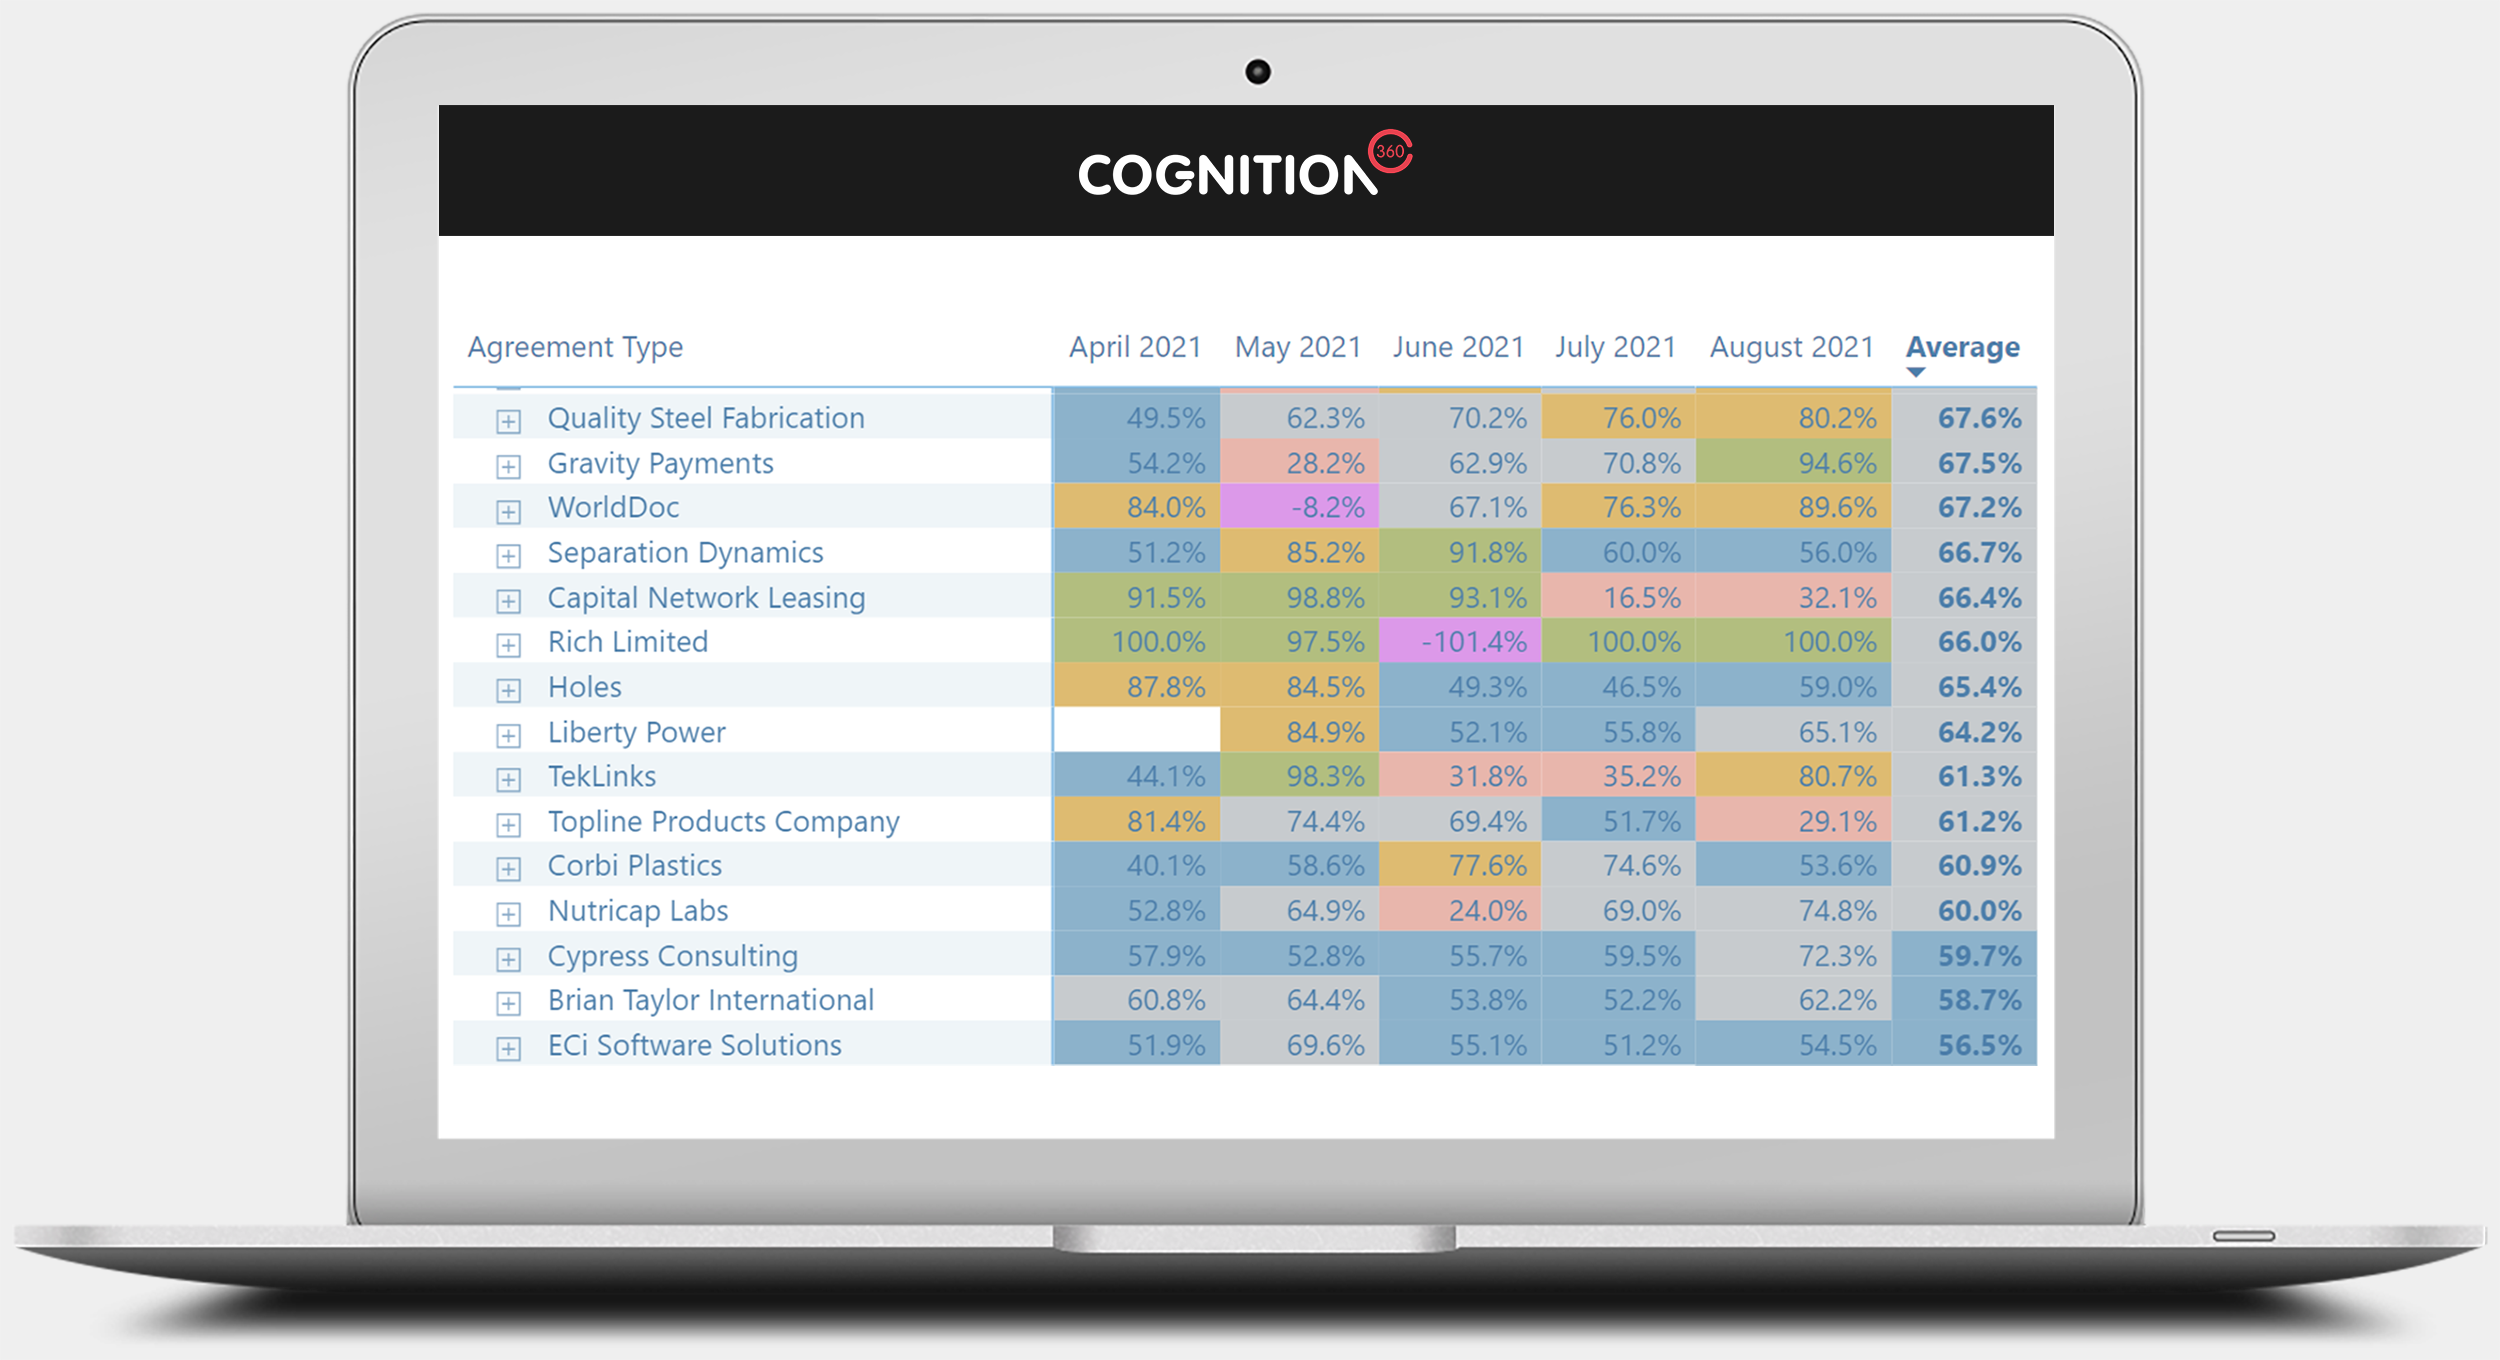
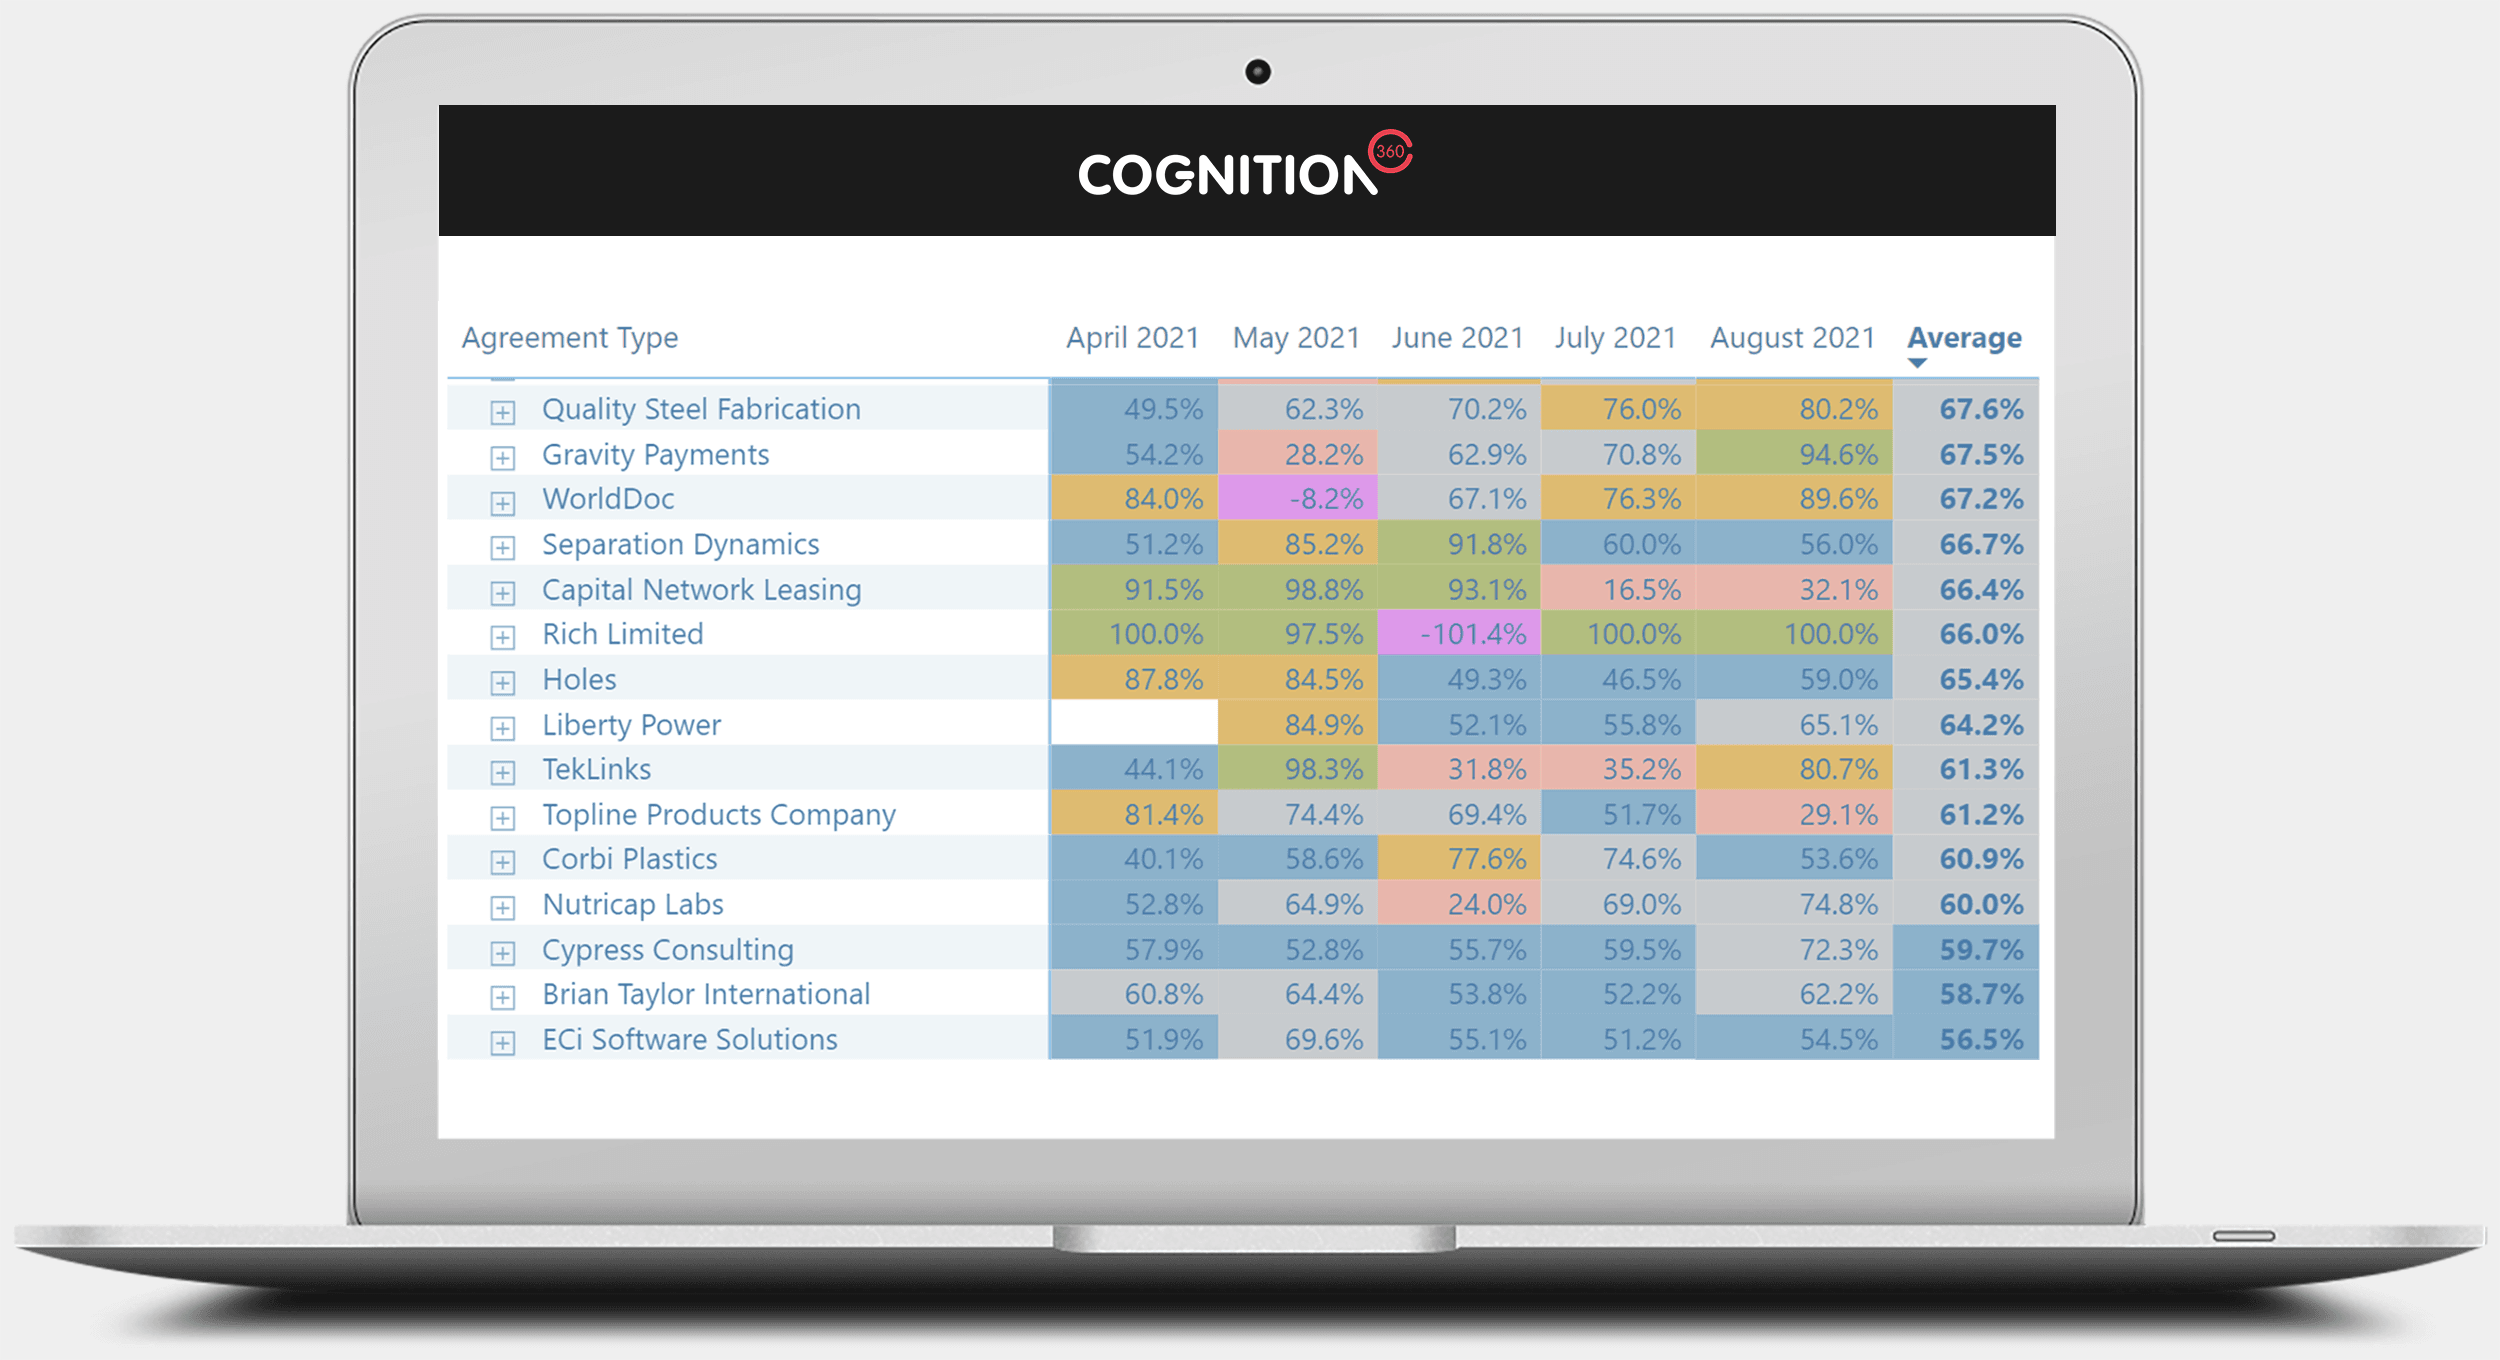
View Shown: Agreement Margin
View margin on agreements month over month. See trends in the data and drill through further to labor data on the agreement, to identify potential causes of reductions or increases in margins.
(Number of report views shown: 1)
Image too small? See full size image here
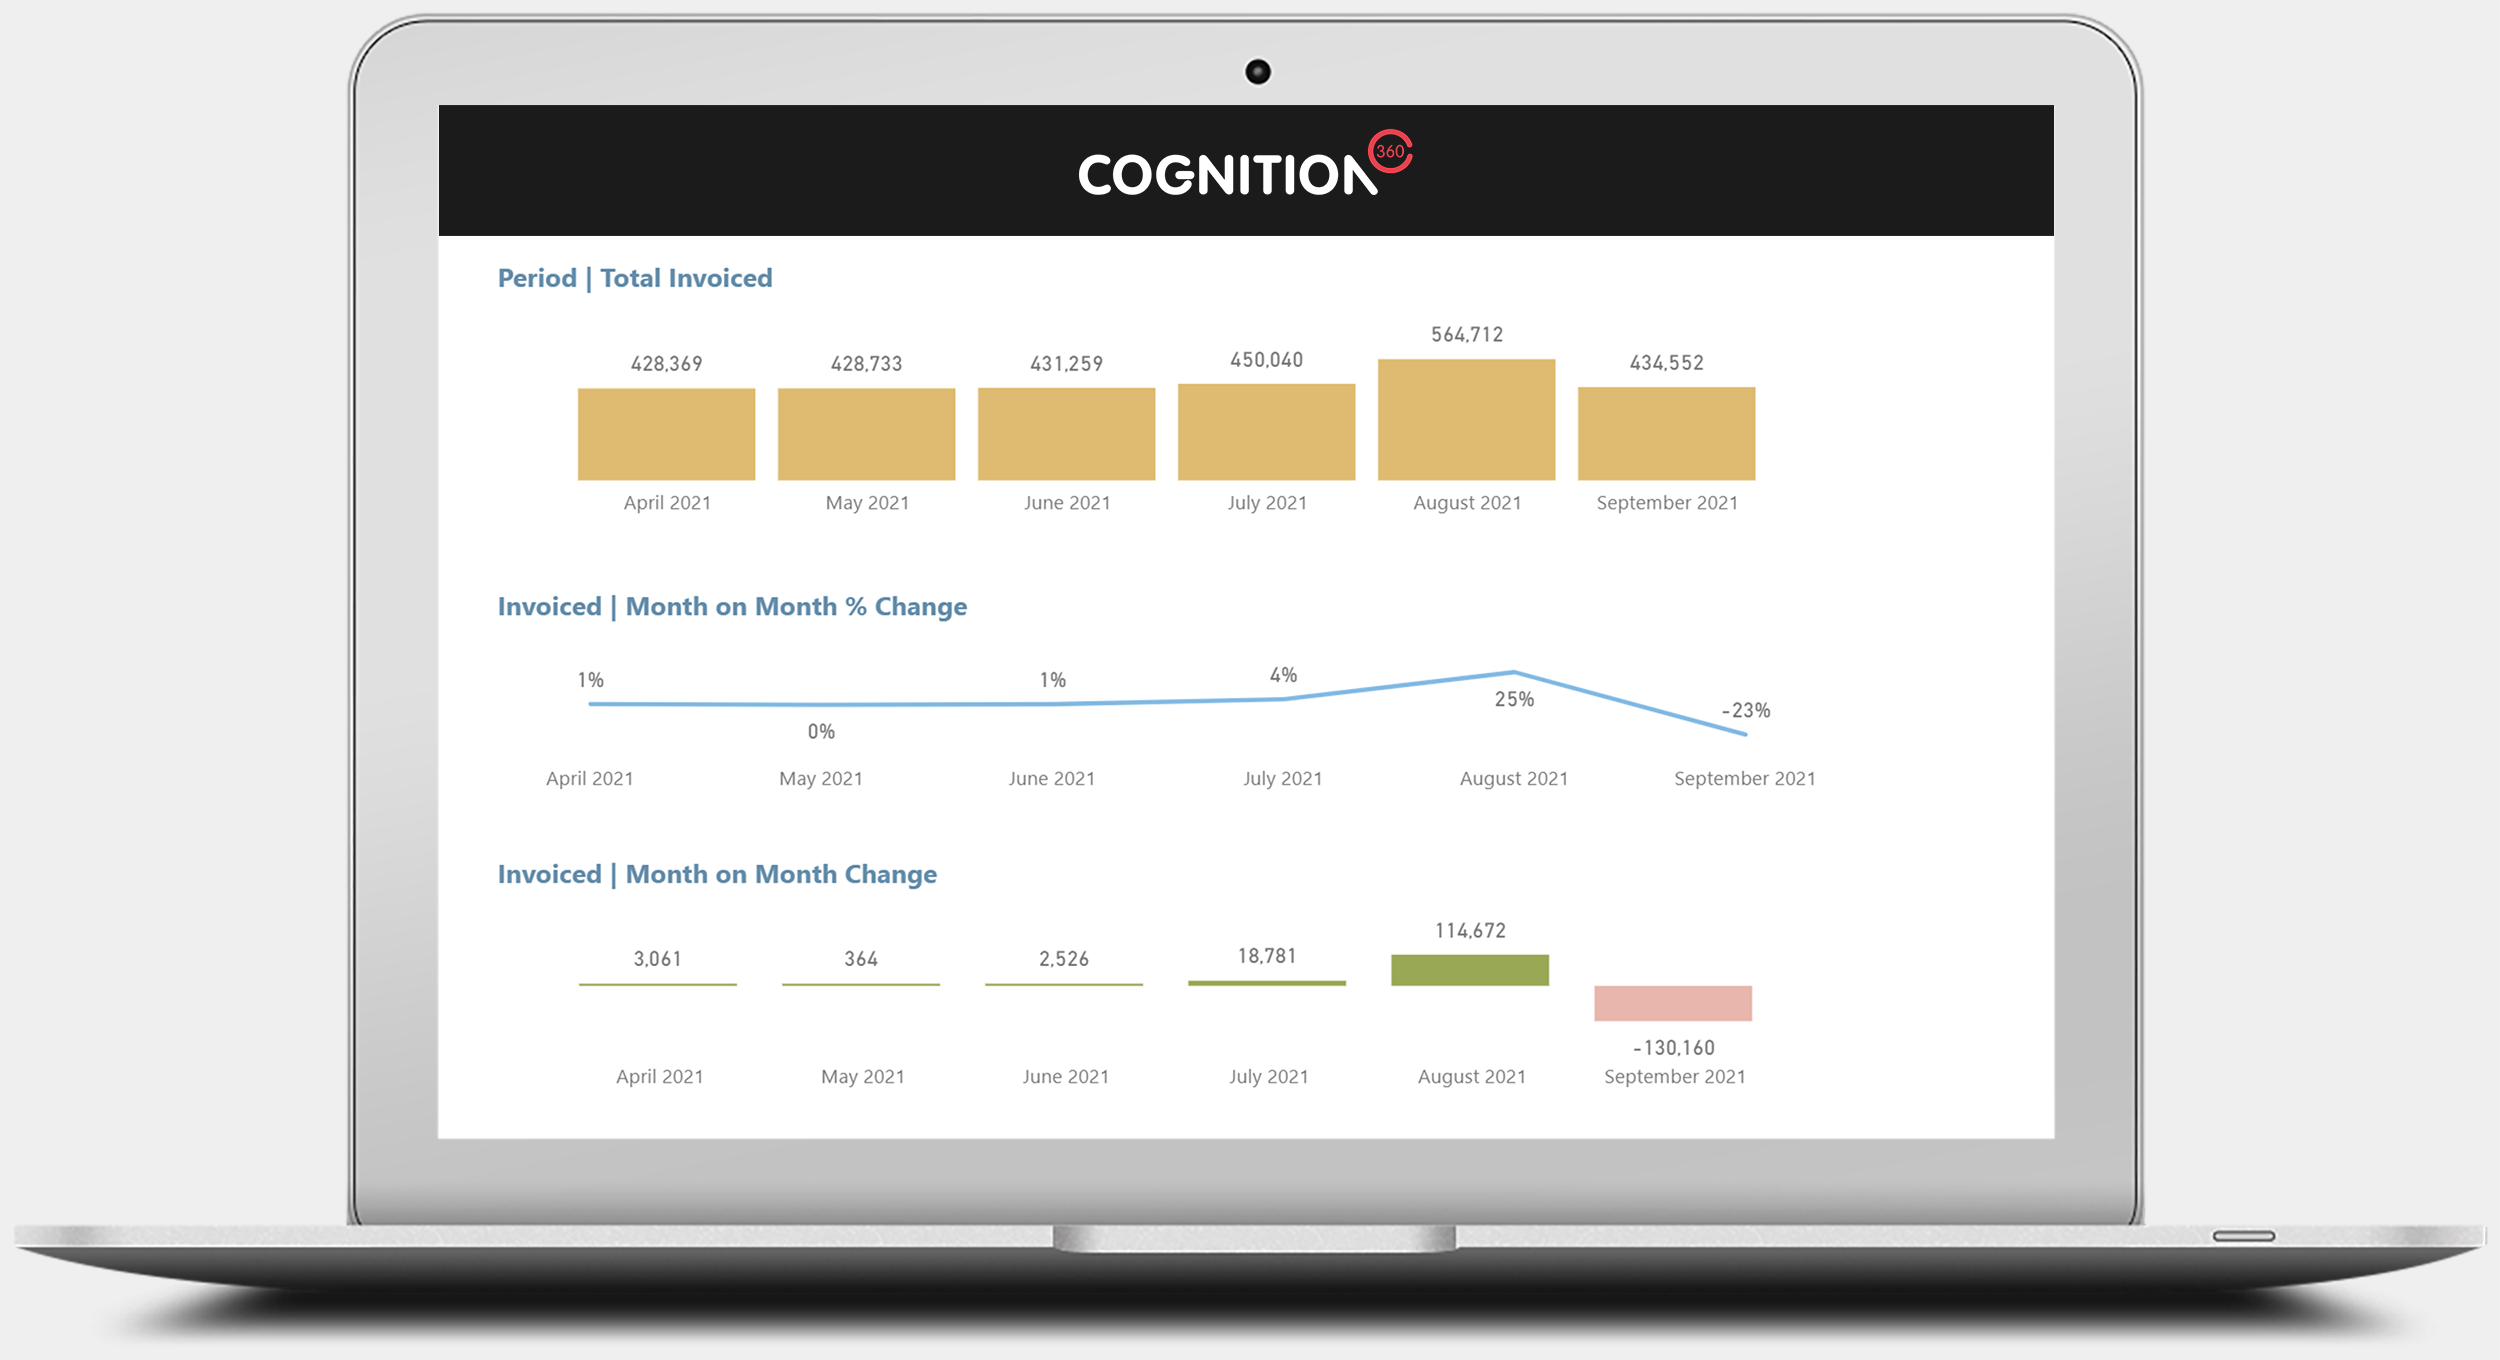
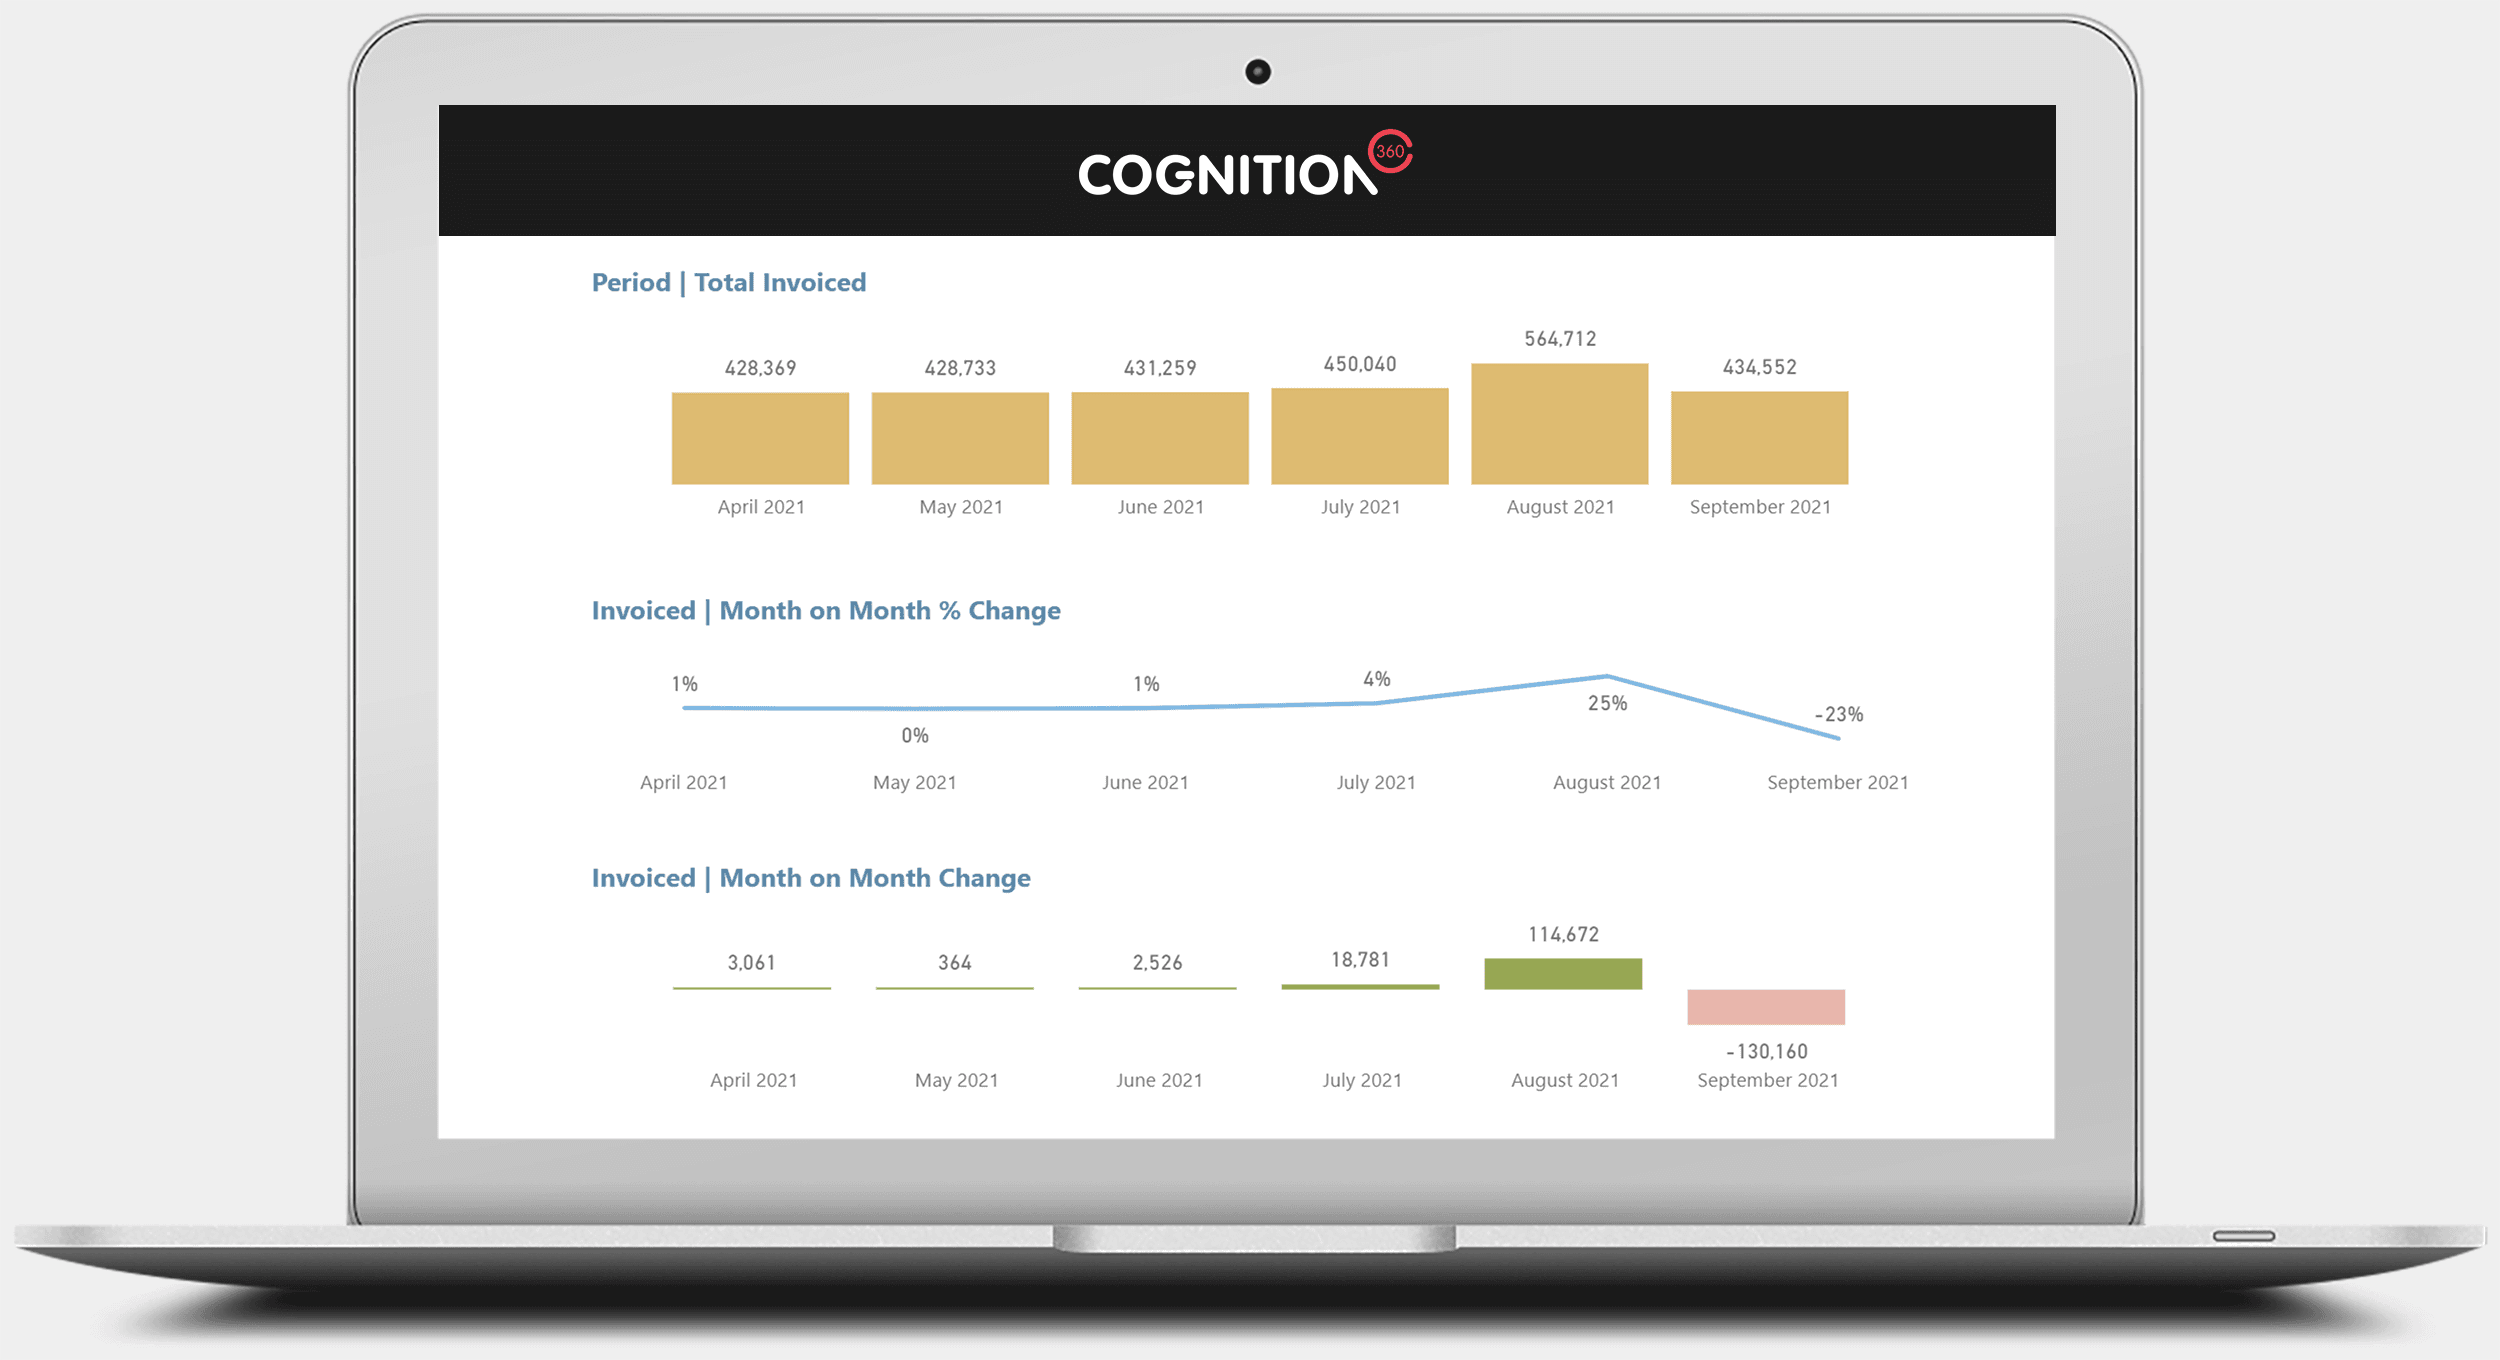
View Shown: Invoice Data
Review invoice data on agreements. See month-on-month invoiced amounts and changes for both value and percentage.
(Number of report views shown: 1)
Image too small? See full size image here
Customer Profitability Report
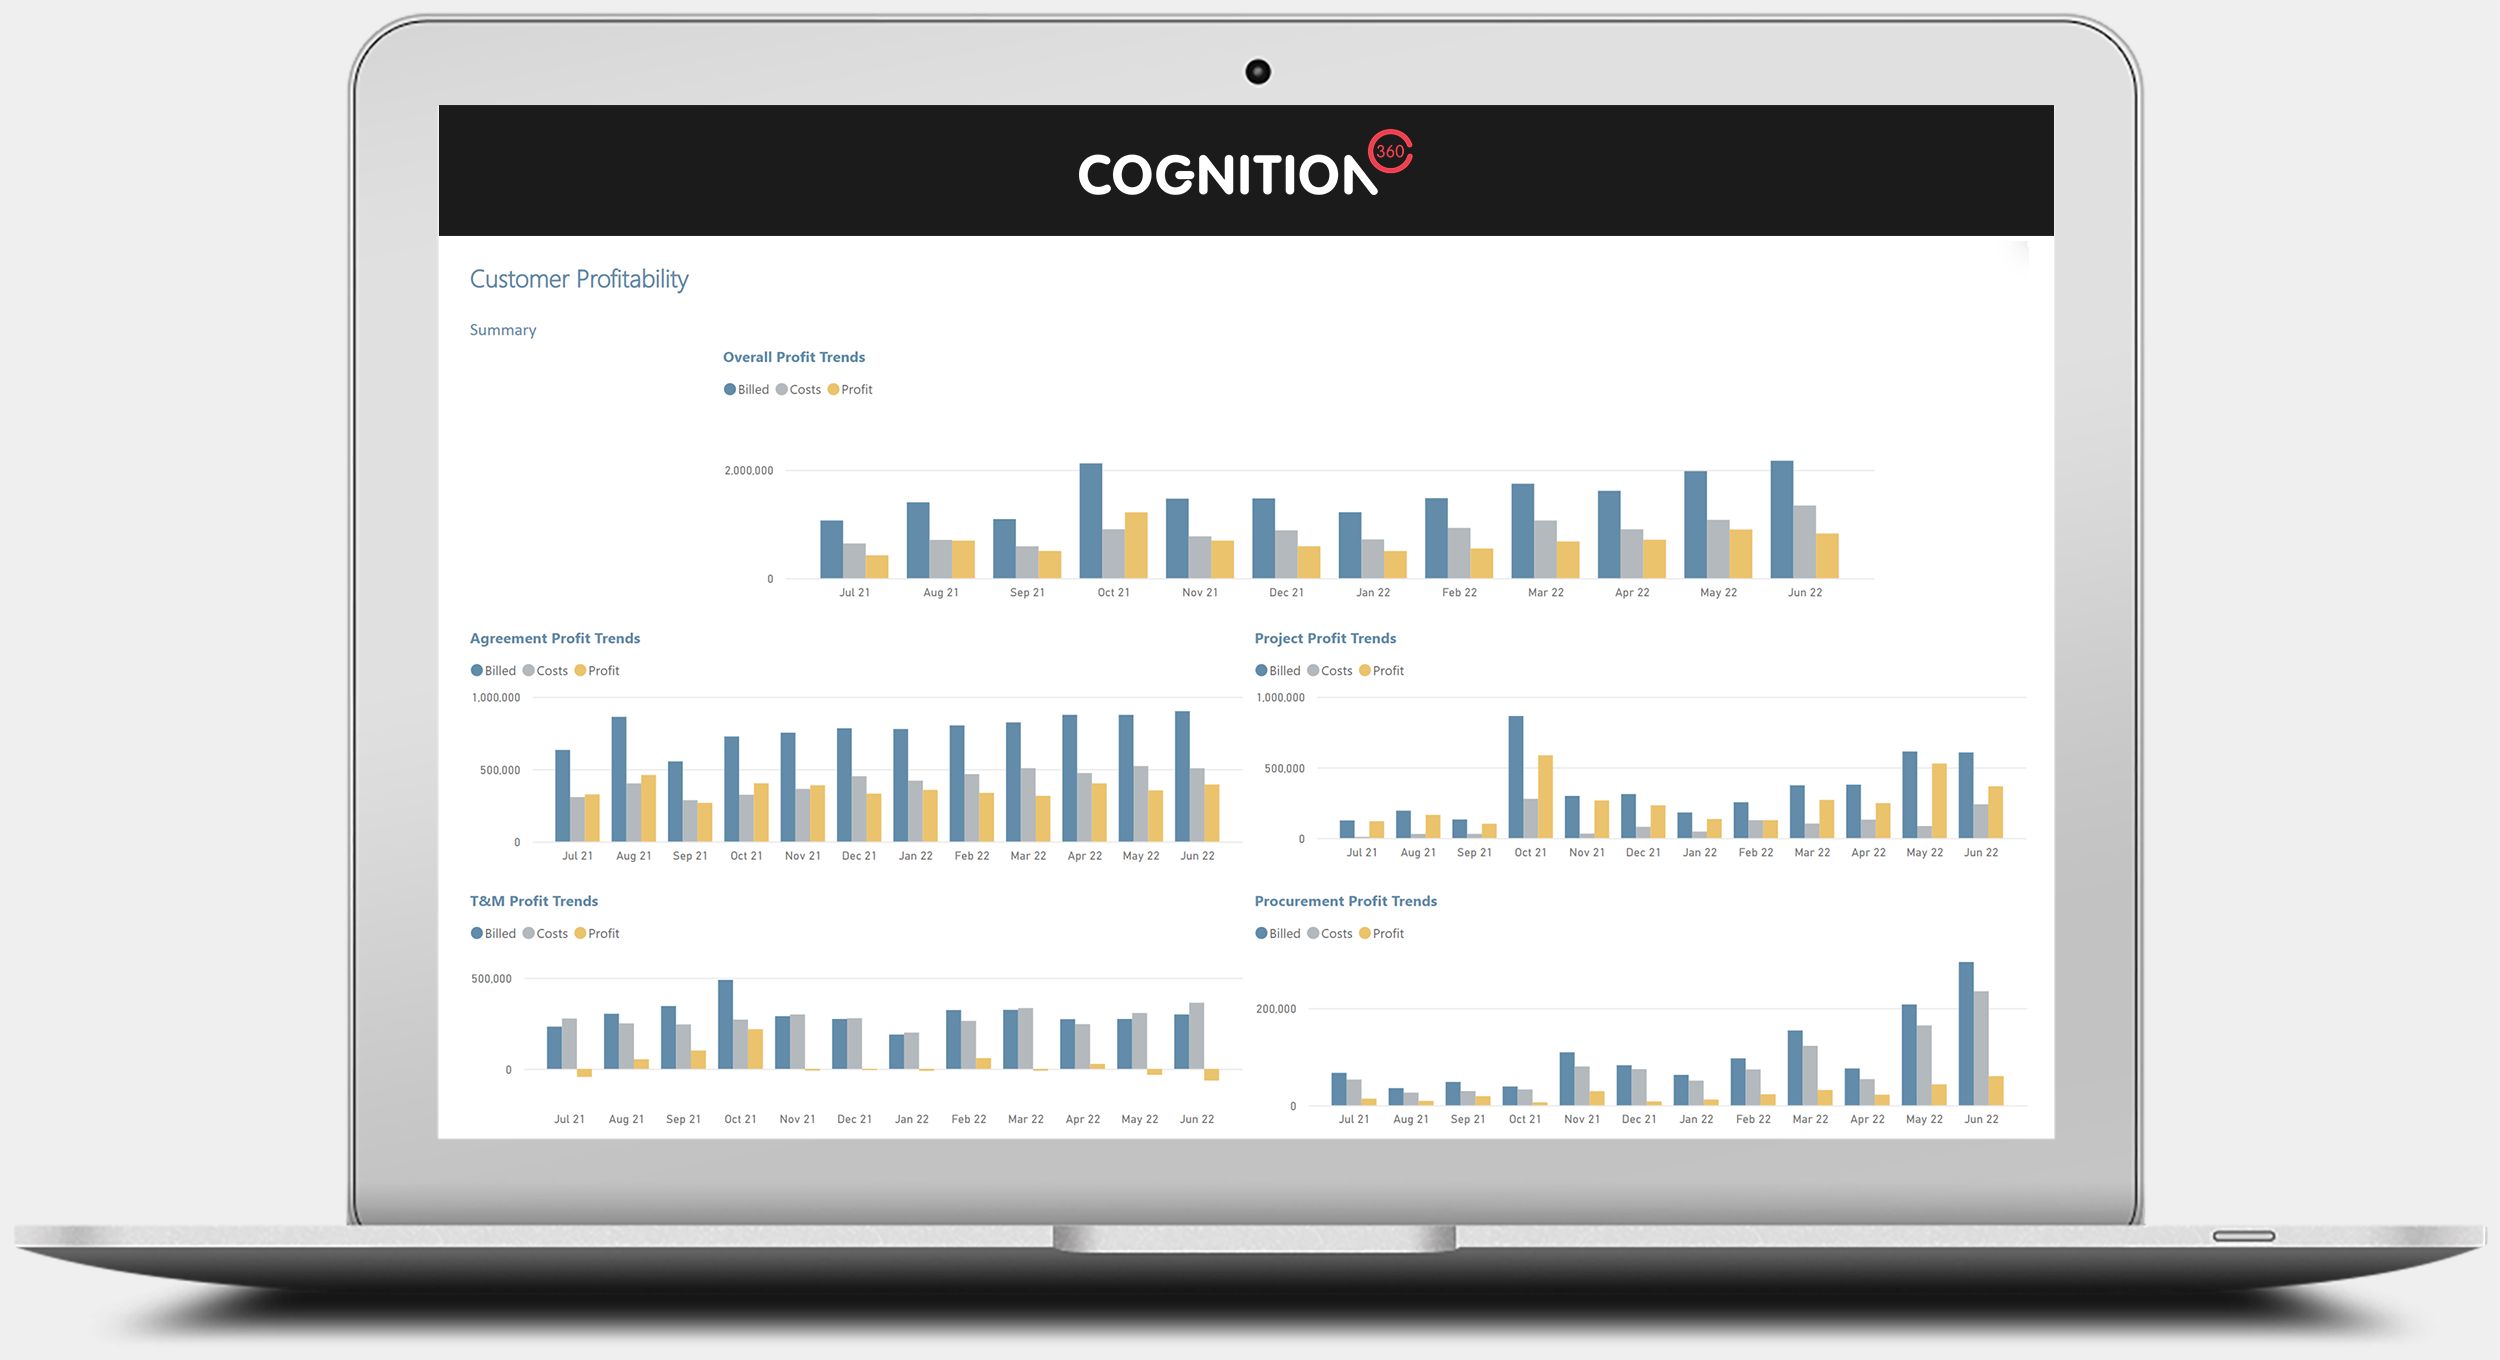
View Shown: Customer Profitability Summary
Review customer profitability-based invoiced data. This report shows profitability across Agreements, Projects, Procurement, and Service invoices.
(Number of report views shown: 1)
Image too small? See full size image here
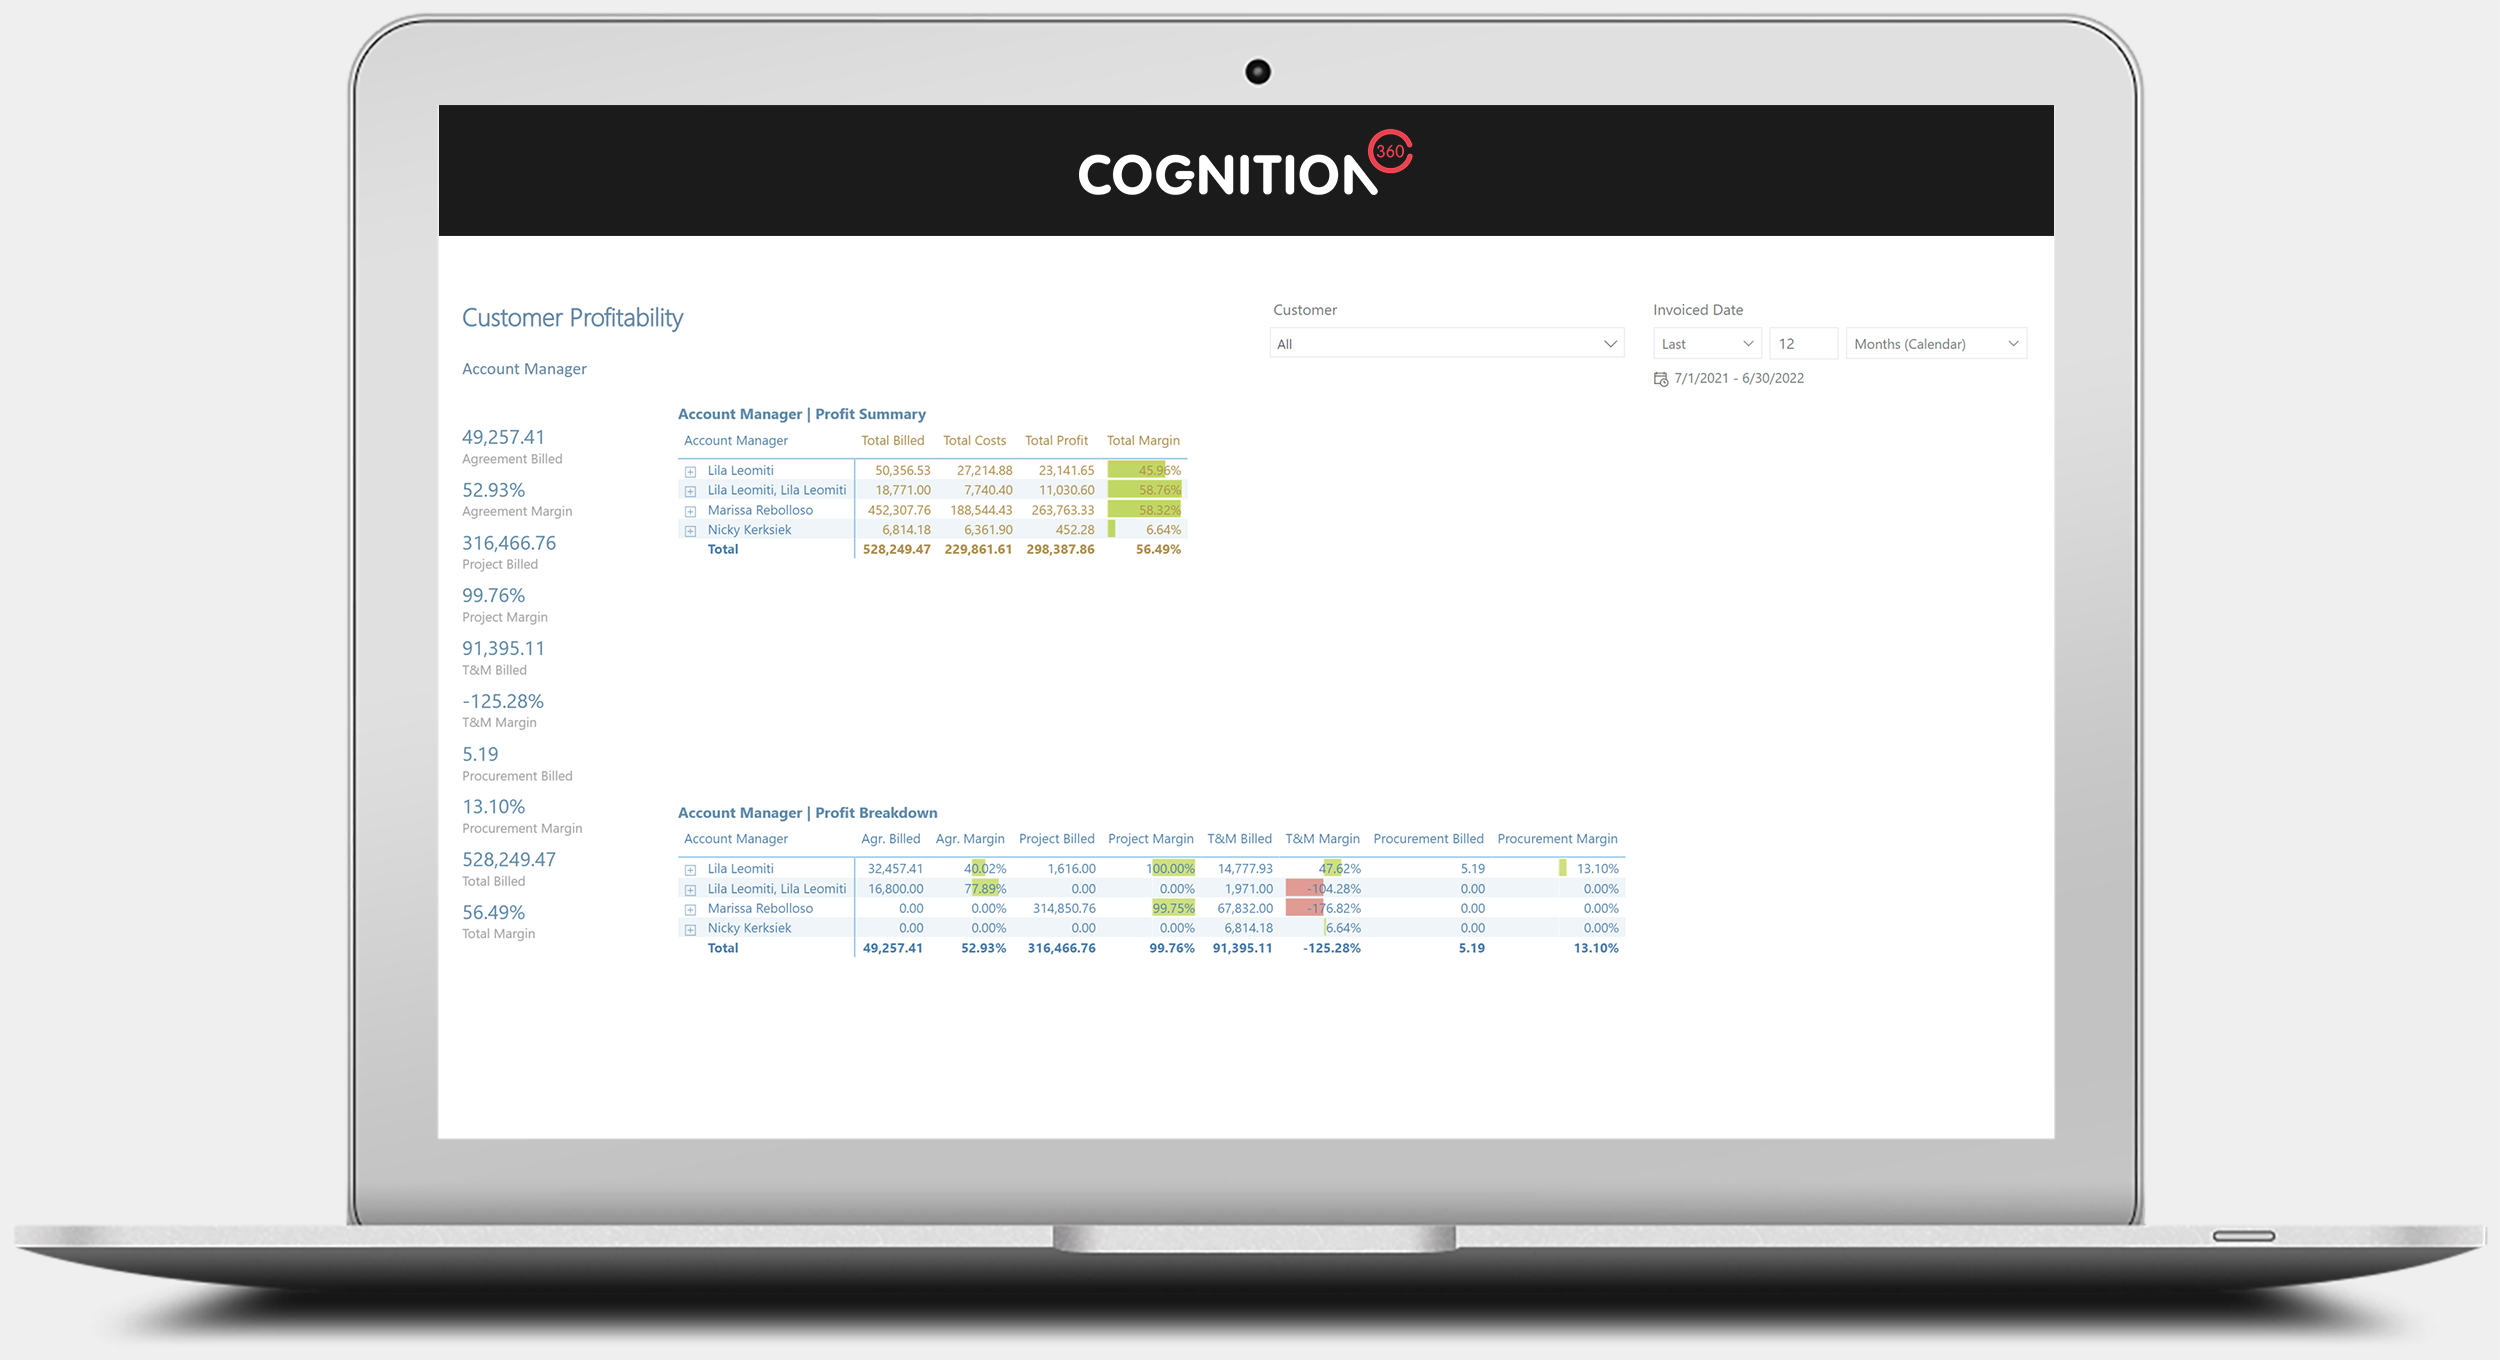
View Shown: Account Manager Profitability Data
Account Manager profitability data is reported and can be expanded to the clients for the account manager.
(Number of report views shown: 1)
Image too small? See full size image here
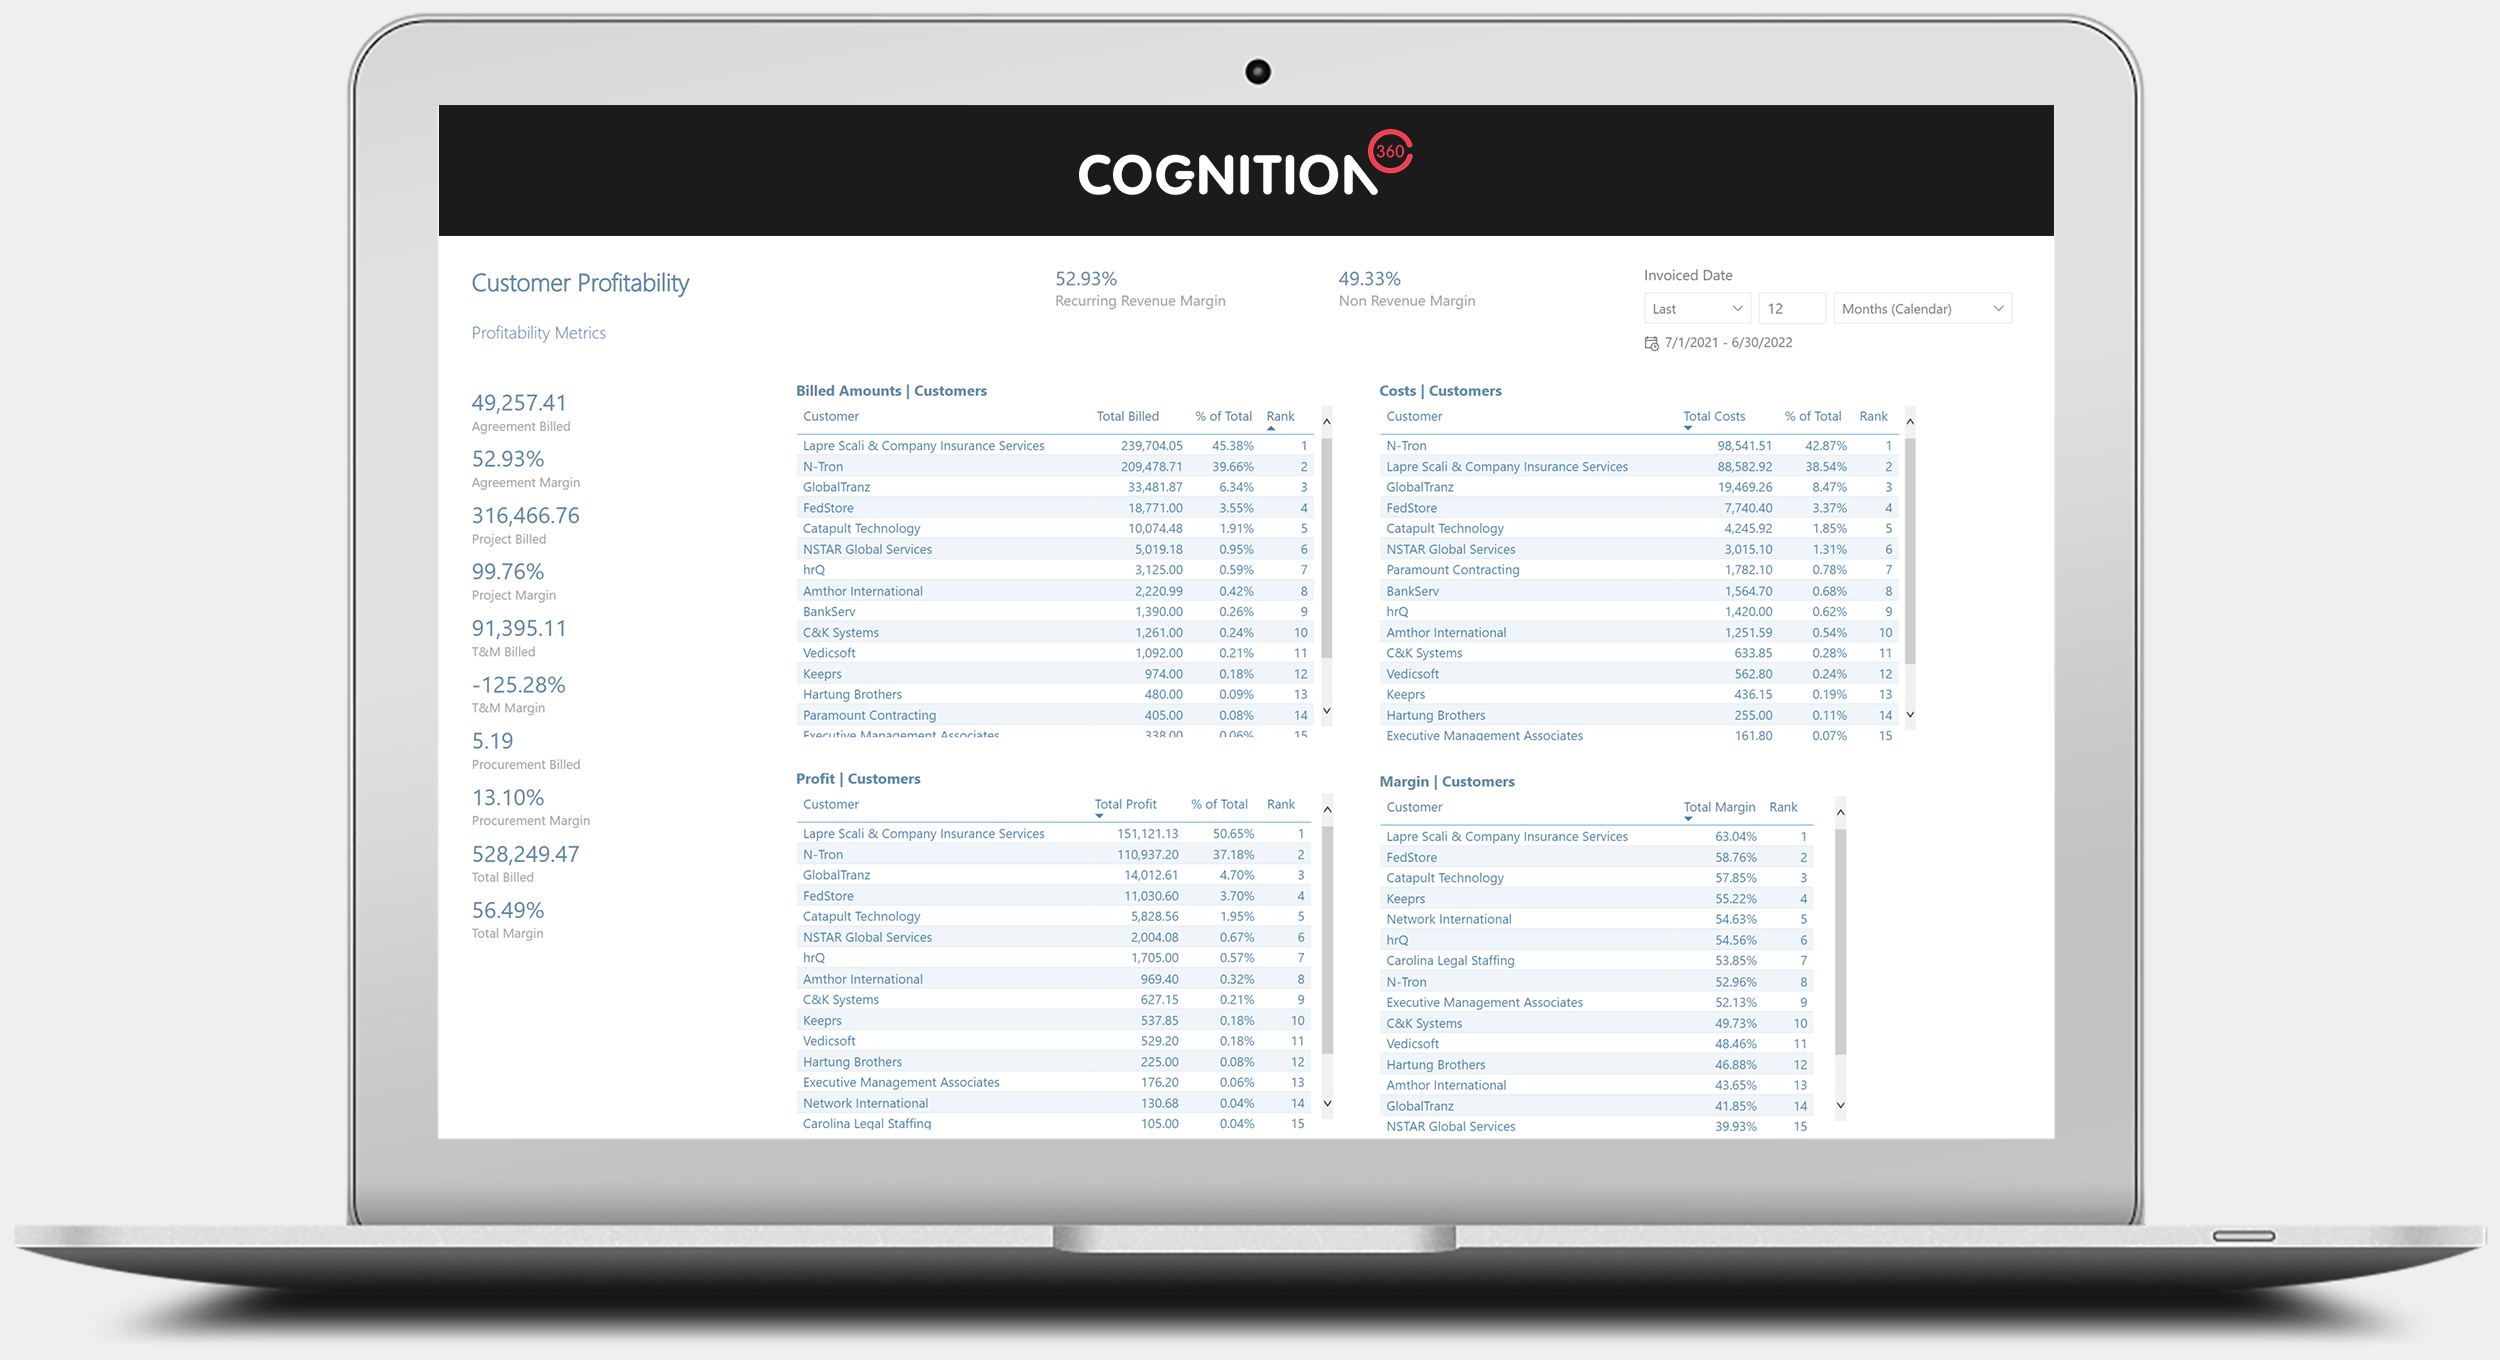
View Shown: Profitability Metrics
The Profitability Metrics view shows customer data by the percentage of the total for Billed Amounts, Costs, Profit, and Margin. It allows the user to see if any client is contributing to a large percentage of any category e.g., 20% of overall billing.
(Number of report views shown: 1)
Image too small? See full size image here
June 2022
Project Reporting: Updates and New Reports
We’ve recently updated our existing Project Reports, updating various pages and adding several new ones. We’ve also added some completely new reports. New pages and reports are available to existing customers.
Not a customer yet? Join us for a demo, or get started risk-free. We’ll be in touch with options for you.
- Project Summary Report (Updated and New pages), including: Summary Screen (Updated); Project Details (Updated); Weekly Dashboard (Updated); Project Completion (New page); Project Manager (New page); Board Summary (New page); Project Metrics (New page); Project Labor (New version of a previous page).
- Project Schedule Compliance Report (Updated)
- Project Resource Labor Report (New), includes: Technician Summary; Ticket TSI (Ticket, Subtype & Item).
- Project Opportunity Revenue Report (New), includes: Closed Project Summary; Open Project Summary.
- Project Progress Billing Report (New), includes: Project Progress Billing Summary; Project Manager Summary.
- Project Labor Billing Report (New), includes: Project Labor Billing Summary; Non-Billable Labor.
See below sample screenshots from the following NEW reports: Project Resource Labor Report, Project Opportunity Revenue Report, and Project Labor Billing Report. Click on any image for a full-size view.
Project Resource Labor Report
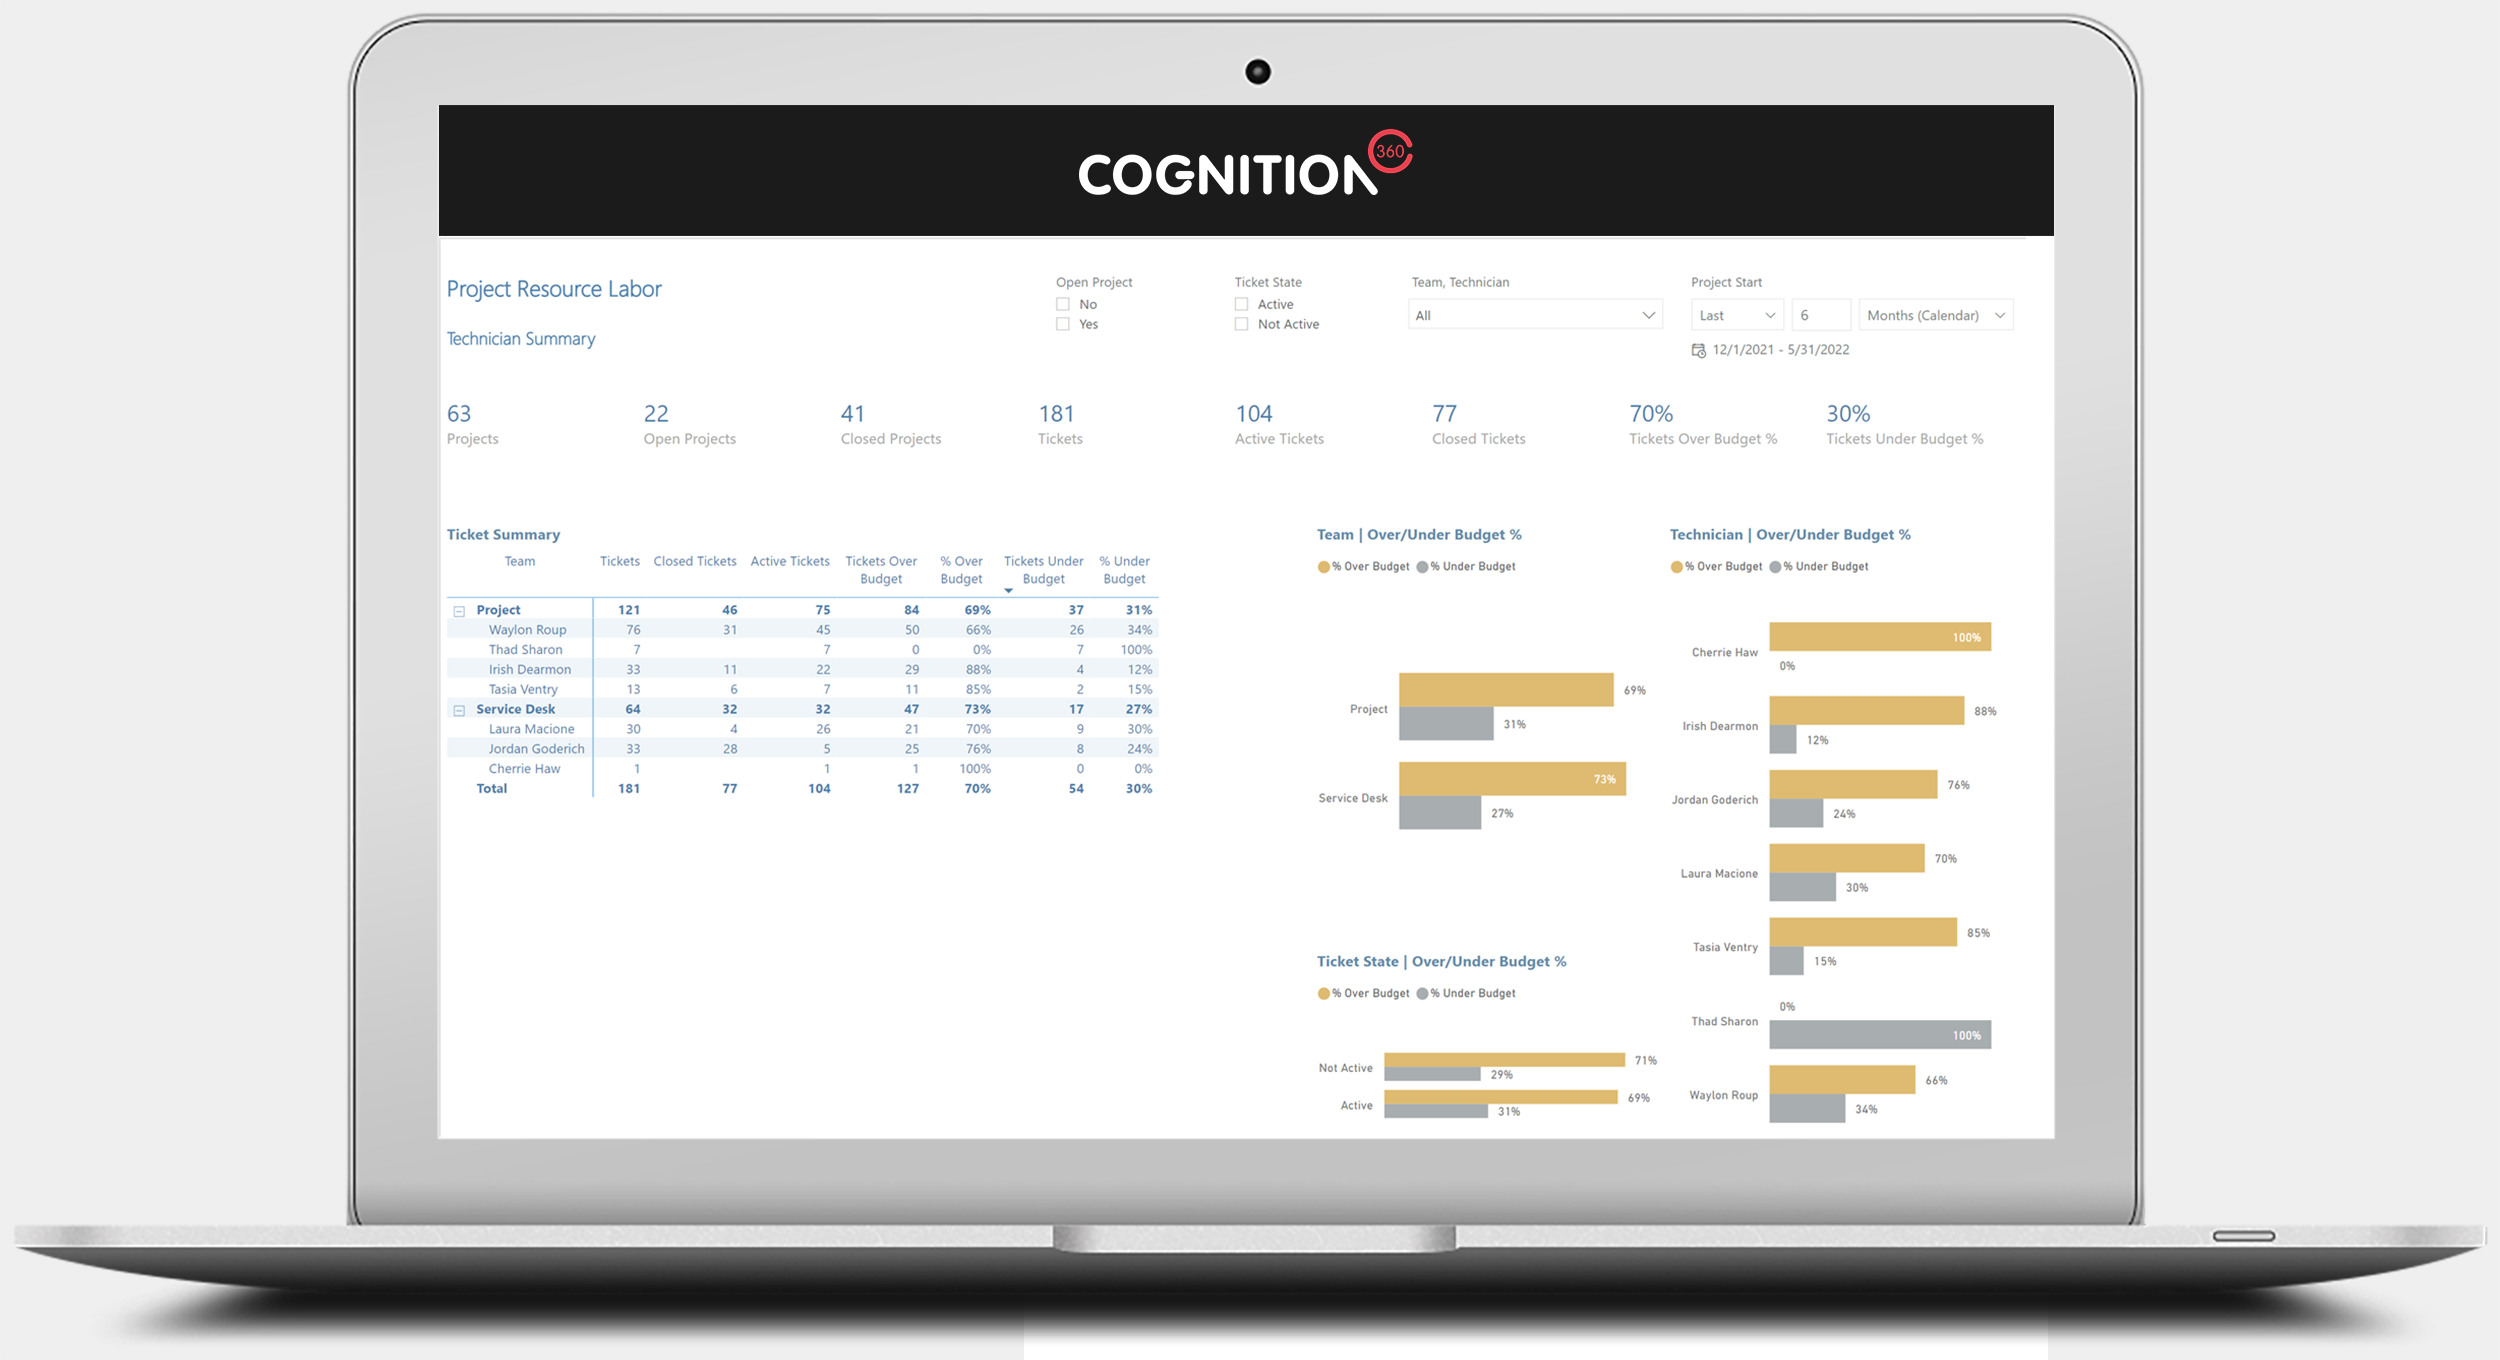
Page shown: Technician Summary
The Project Resource Labor Report shows how teams and technicians are performing for labor recorded to project ticket budgets. The data shows tickets and percentage of tickets both over and under budget.
(Number of report views shown: 1)
Image too small? See full size image here
Project Opportunity Revenue Report
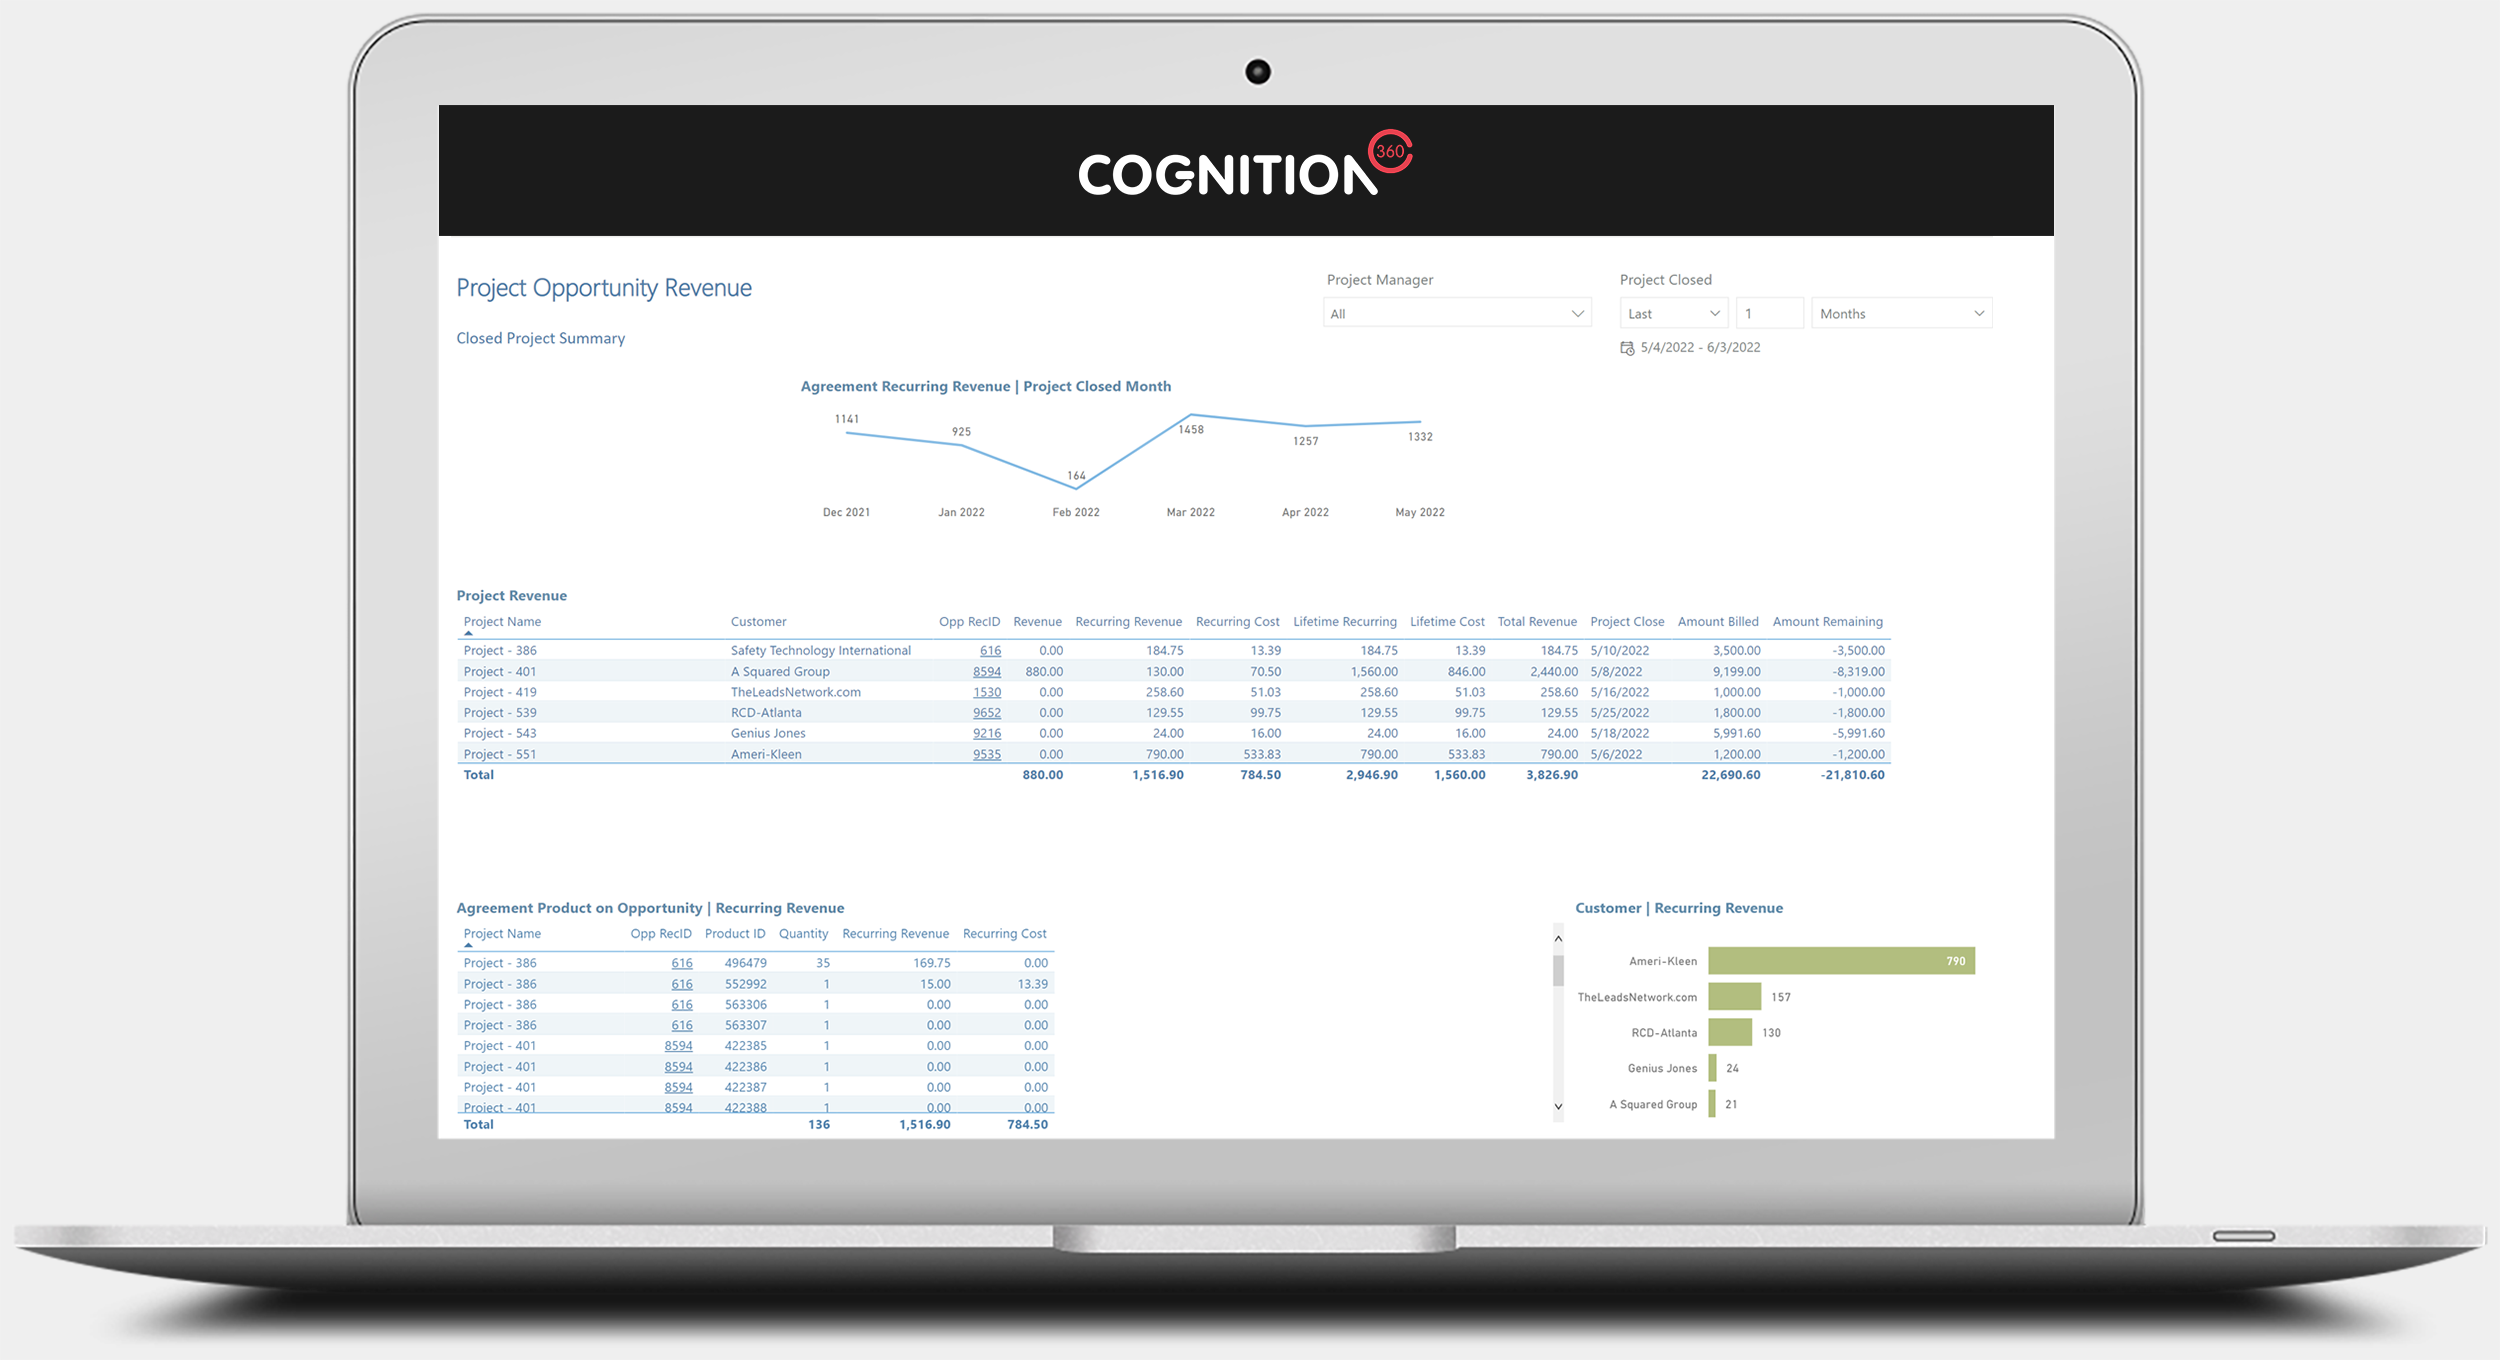
Page shown: Closed Project Summary
The Project Opportunity Revenue Report shows opportunity data related to projects and any additional revenue on the opportunity that could commence as Recurring Revenue once the project is completed.
Report shows Recurring Revenue values based on products on the opportunity.
(Number of report views shown: 1)
Image too small? See full size image here
Project Labor Billing Report
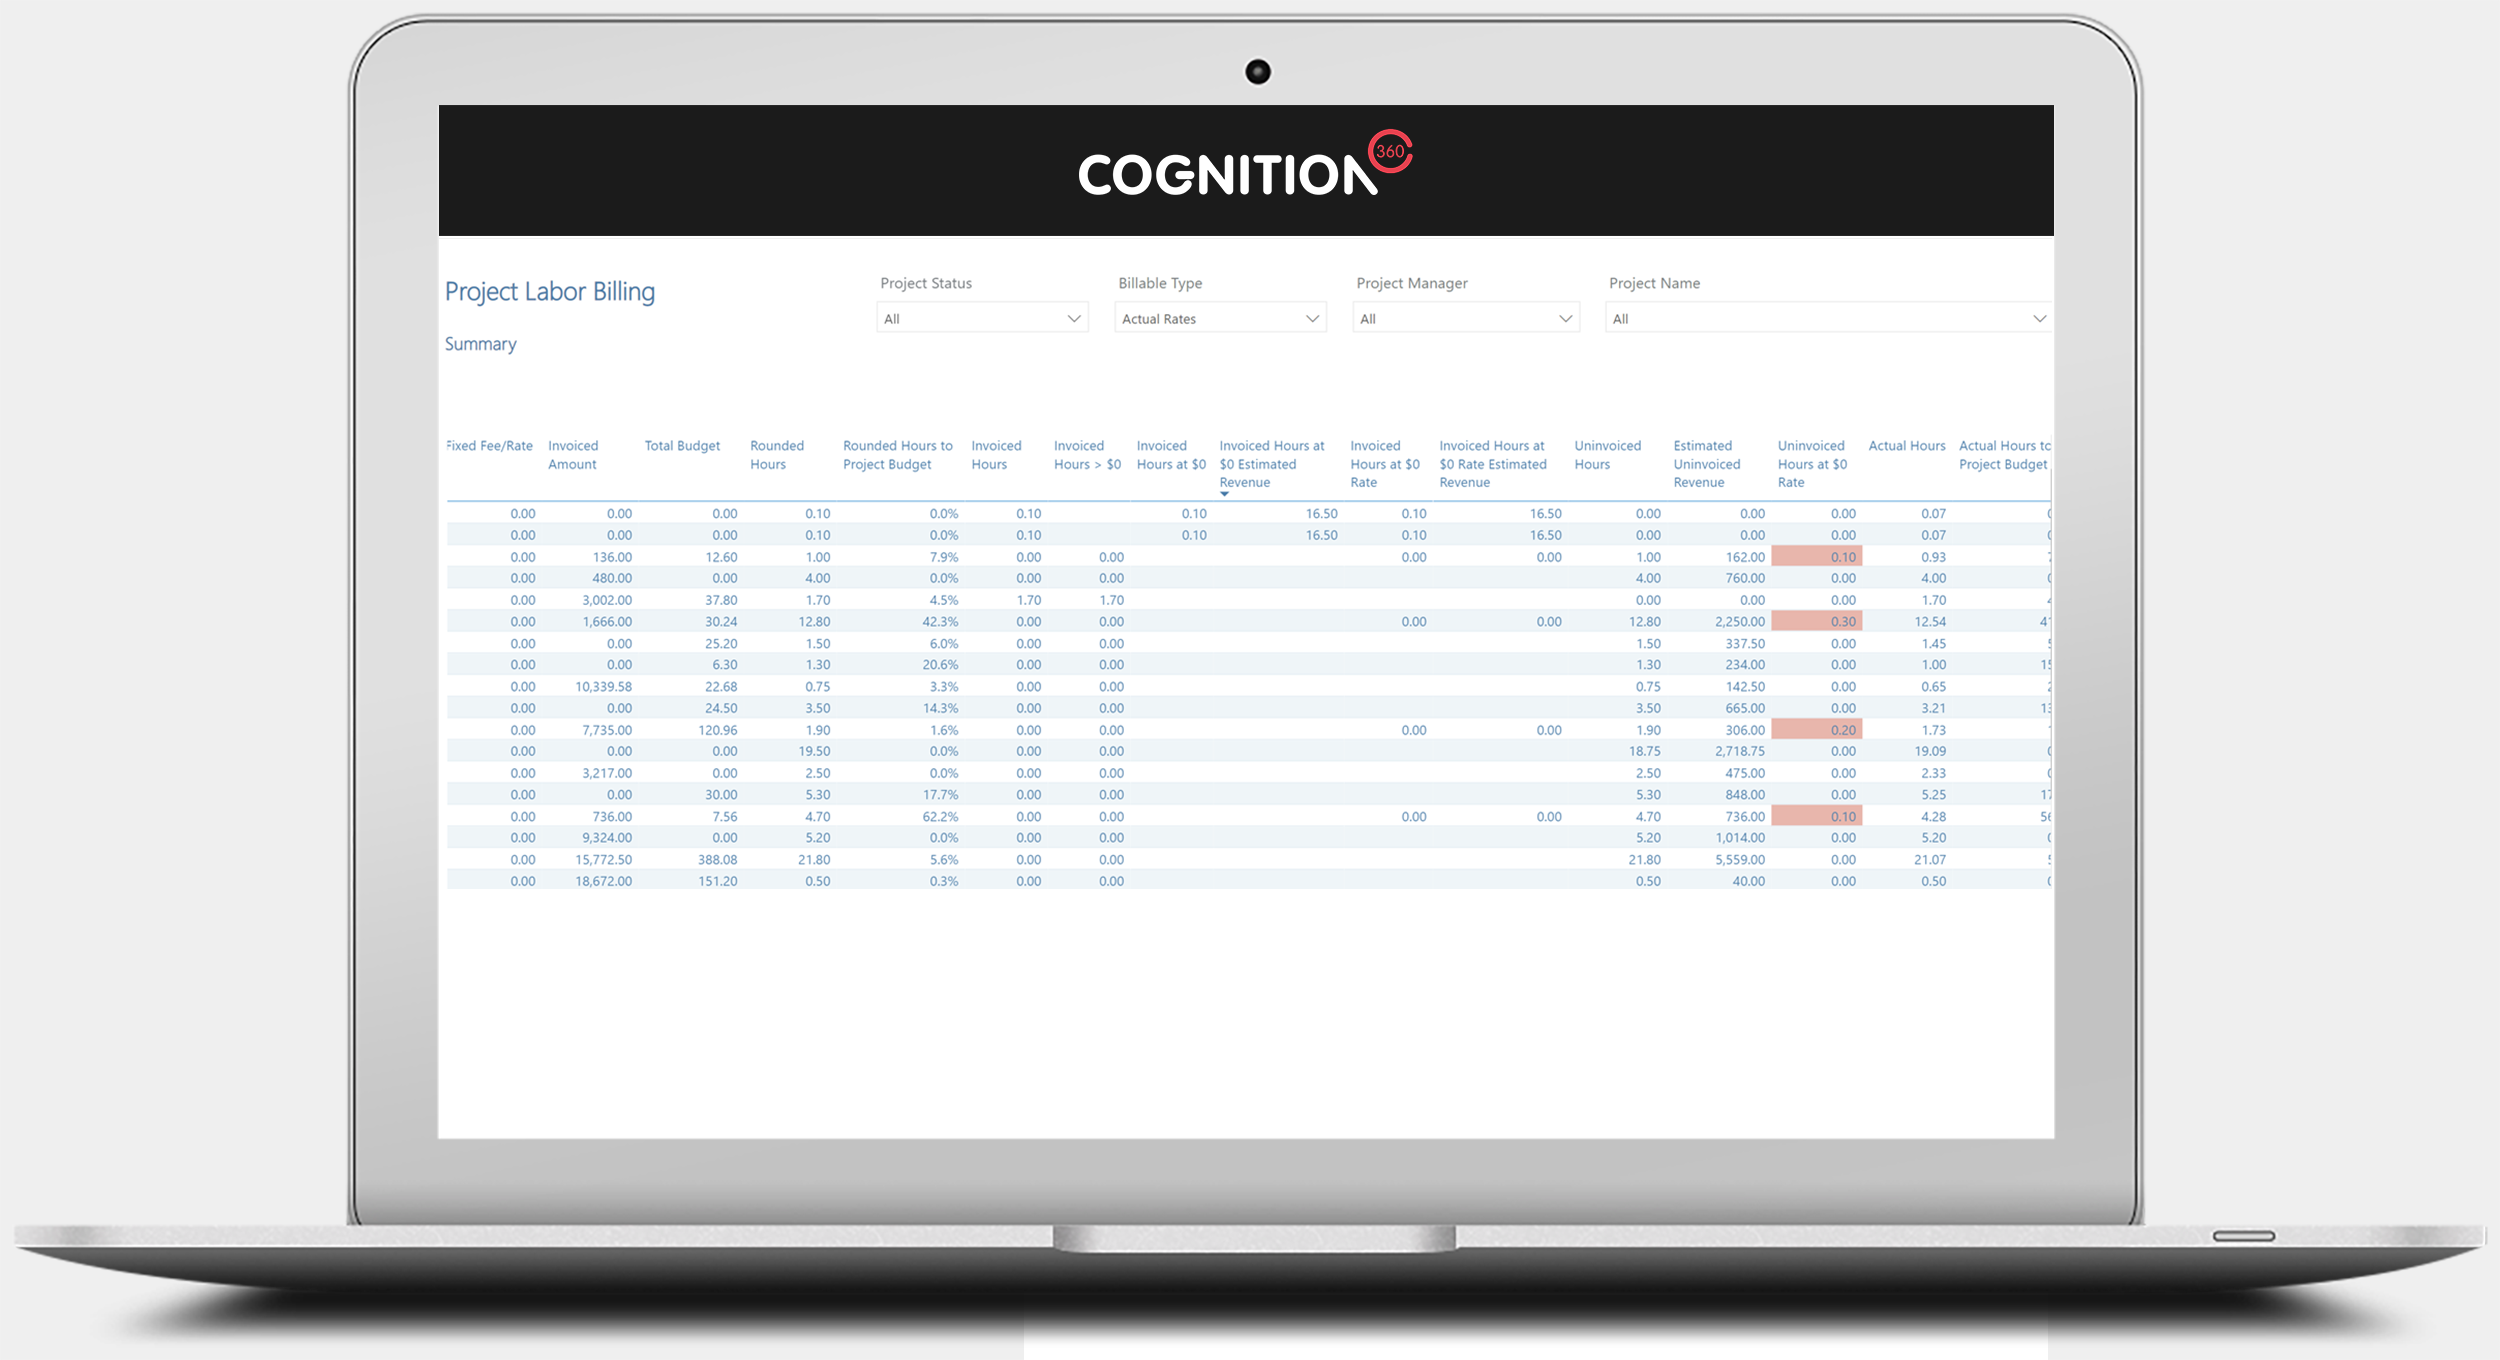
Page shown: Summary
The Project Labor Billing Report highlights labor both invoiced and yet to be invoiced. Any labor invoiced on a $0 invoice which may be incorrectly invoiced. Report shows labor invoiced at $0 rate, to highlight labor that could be recorded incorrectly.
(Number of report views shown: 1)
Image too small? See full size image here
May 2022
Cognition360 LIVE: Updates
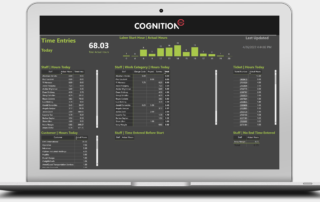
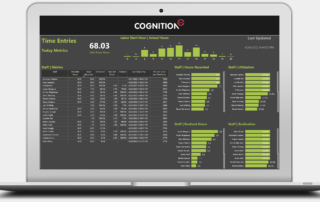
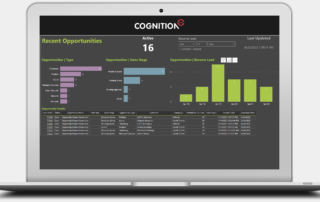
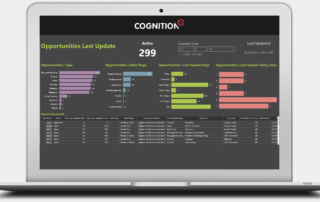
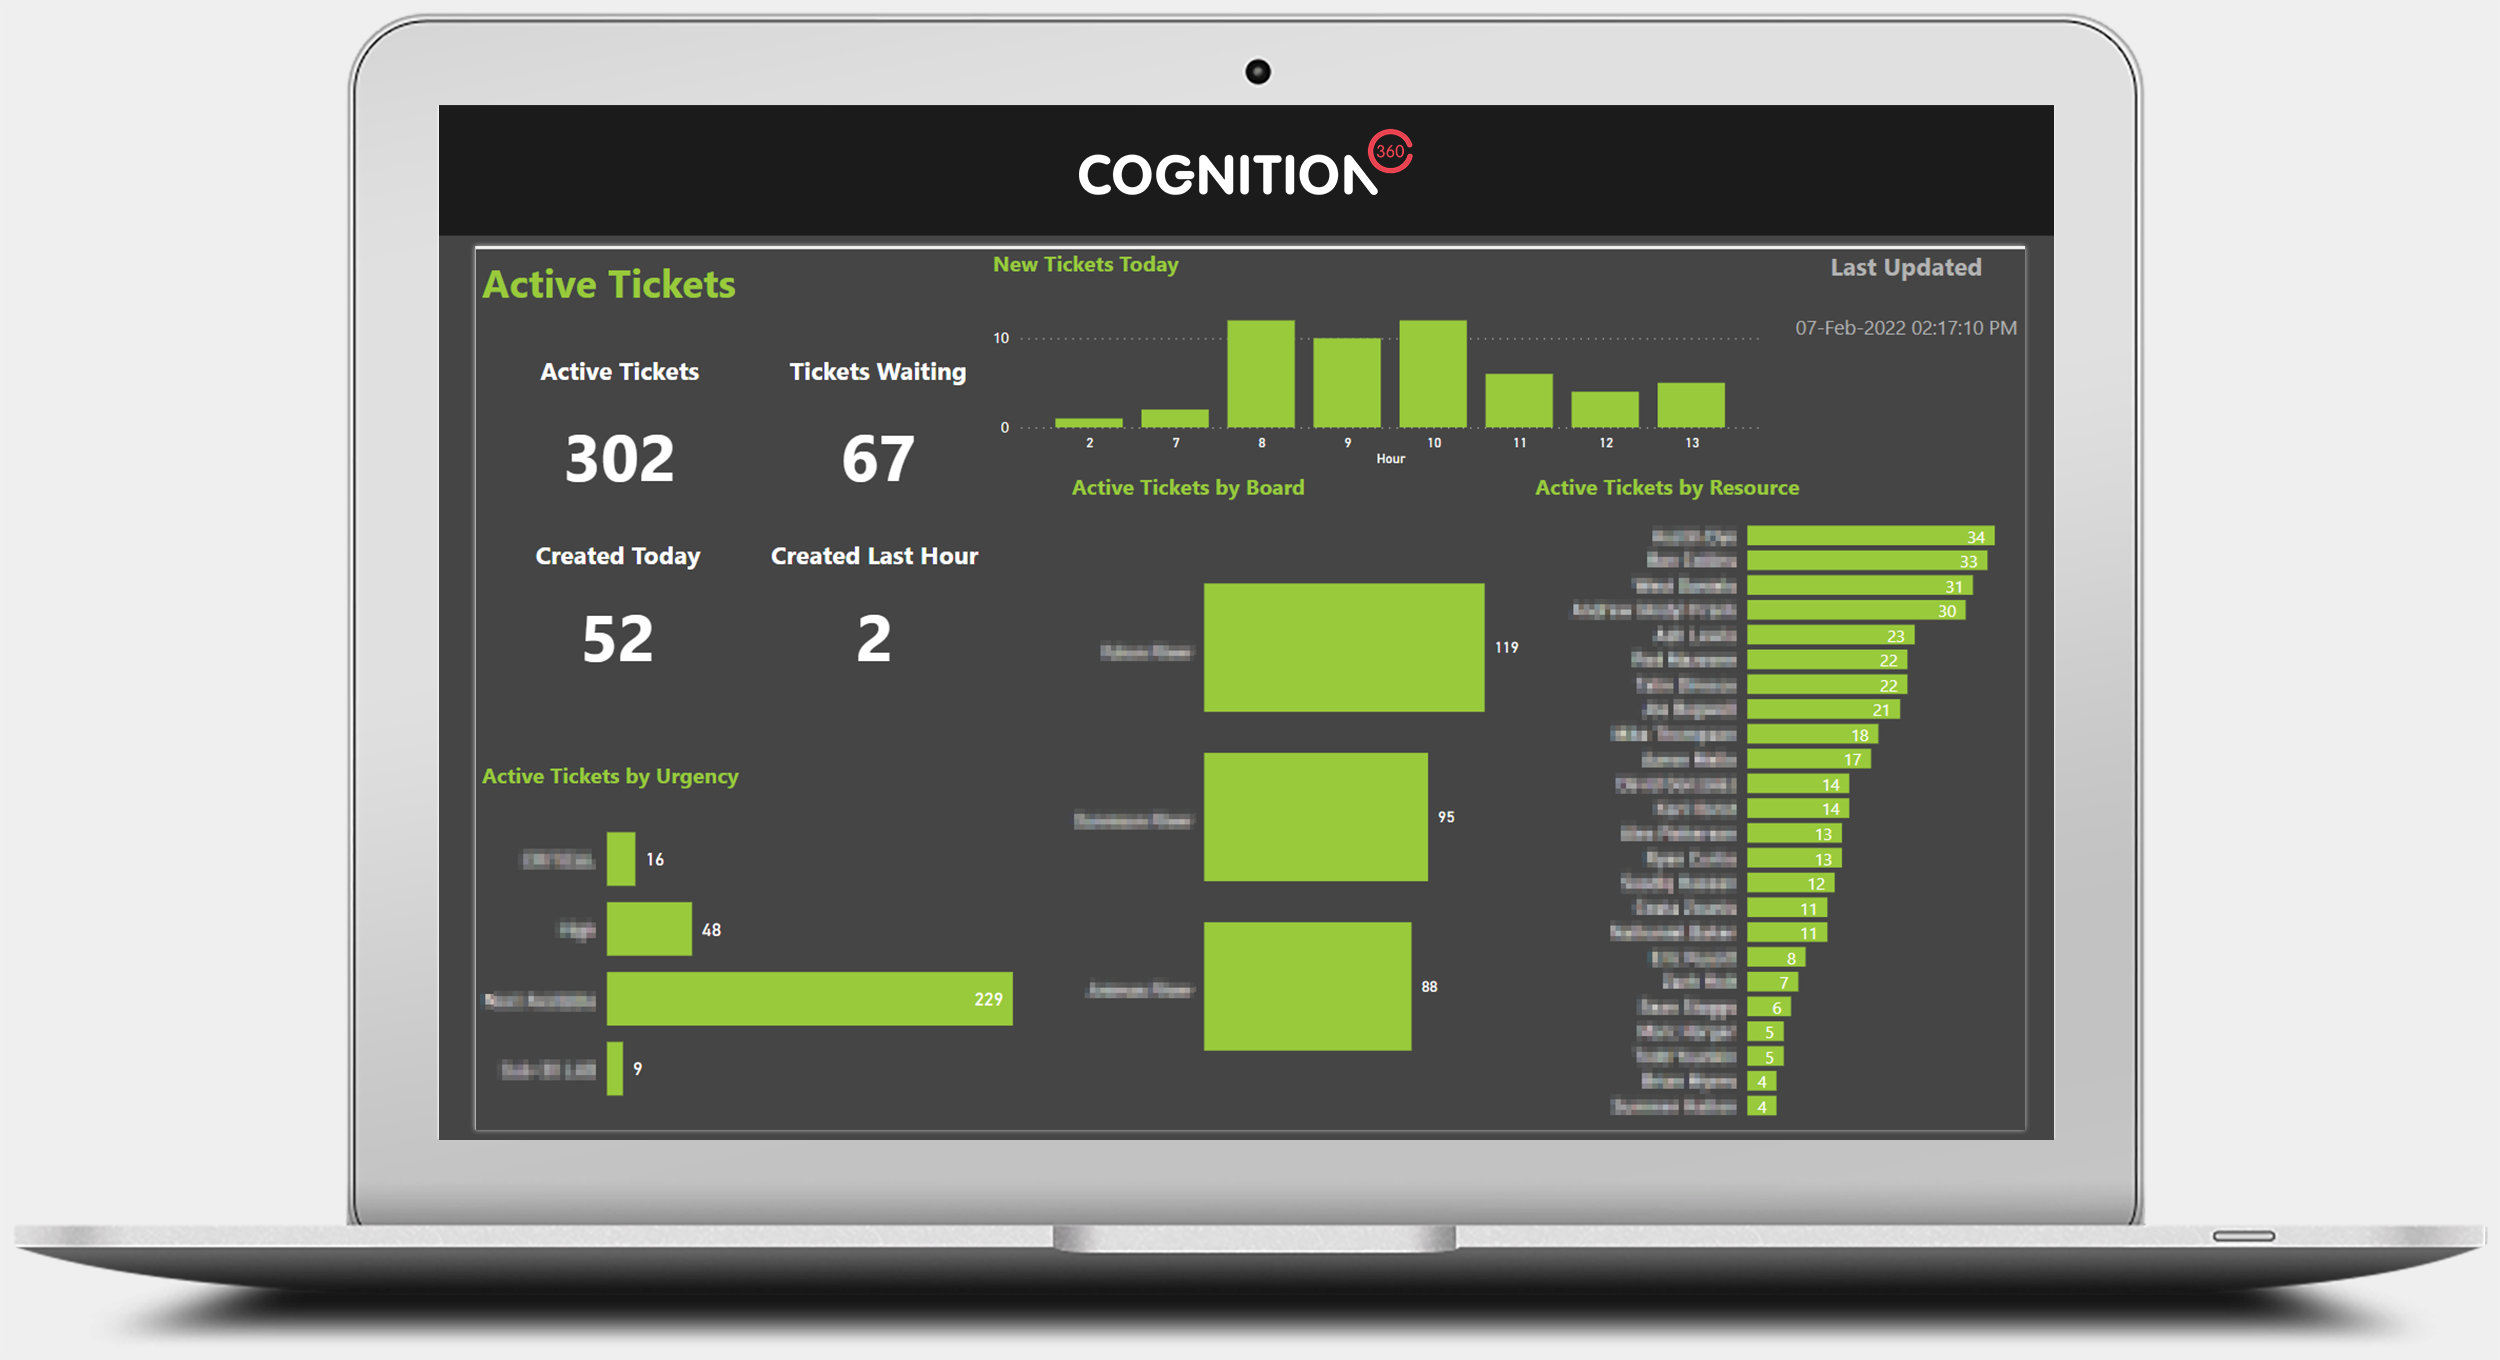
Cognition360 LIVE is our real-time ticket reporting dashboard delivering immediate insights into key ticket data. Our dashboards surface up the key metrics and KPIs that are critical for your business to know in real time.
The latest enhancements and new feature updates to Cognition360 LIVE reports include those made to:
- Time Entry Data – Today & Today Metrics
- Time Entry Data – Today Metrics
- Recent Opportunities & Opportunities by Last Update
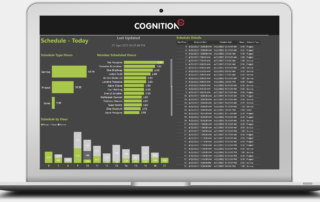
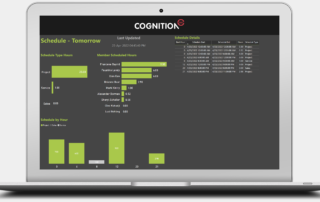
- Schedule Data – Today & Tomorrow
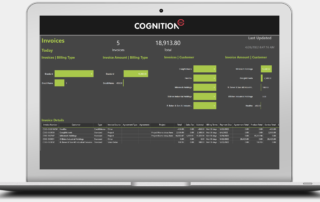
- Invoice Data
All reporting is delivered via Power BI in a pre-built dashboard module for near real-time reporting. See sample screenshots below, using real anonymized customer data. Scroll through the images and click on any one for a full-size view.
Images too small? You can click on any image to bring up the full-size version.
February 2022
Cognition360 LIVE
Cognition360 LIVE is our real-time ticket reporting dashboard delivering immediate insights into key ticket data. Now you can see your important data live – within seconds! Our dashboards surface up the key metrics and KPIs that are critical for your business to know in real time.
Reporting covers the following areas:
- Active Tickets: across boards, urgency/priority, ticket owner and resource
- New Tickets: see data on new tickets today
- Latest Updates: view data on which technicians are updating tickets
- Dispatch: view ticket load by resource and identify which resources can be assigned to tickets by priority
- Resolved: data on resolved tickets today by board, urgency/priority and resource
All reporting is delivered via Power BI in a pre-built dashboard module for near real-time reporting. See sample screenshots below, using real anonymized customer data.
Active Tickets Dashboard
View your active tickets by board, technician/resource, and ticket urgency/priority. See new ticket volumes per hour for that day.
(Number of report views shown: 1)
Image too small? See full size image here
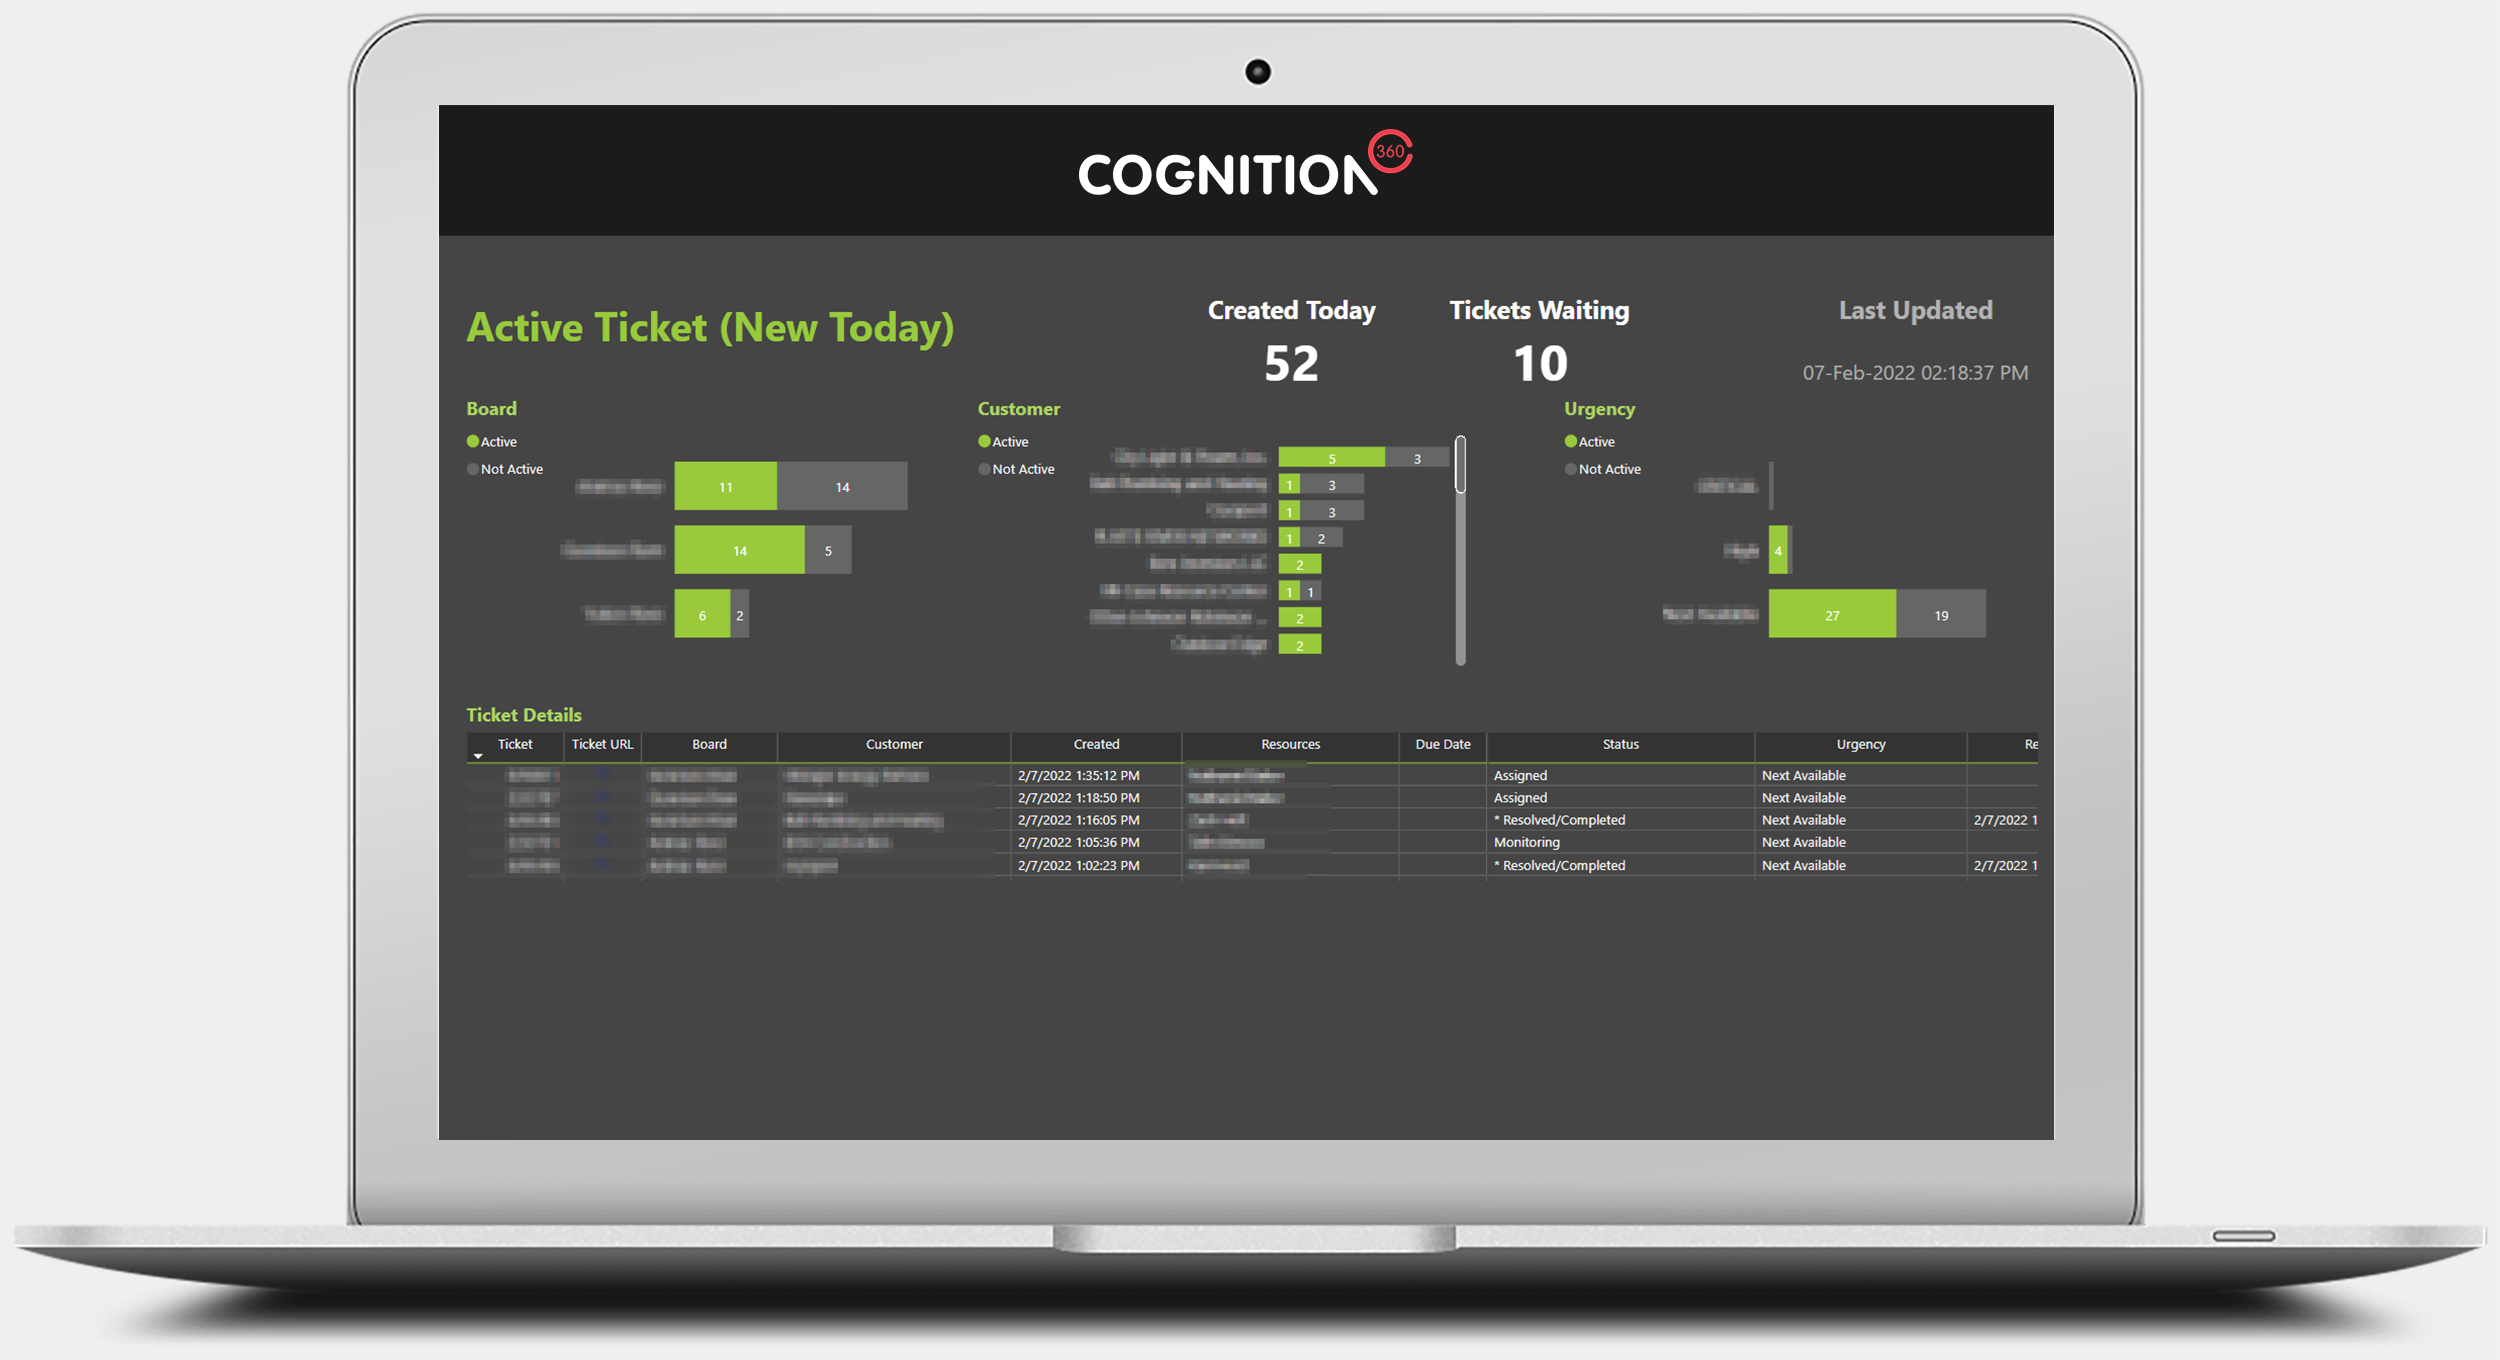
Active Tickets: New Today
This view gives a breakdown of the active new tickets from today. Filter data by board, customer, or ticket urgency/priority.
(Number of report views shown: 1)
Image too small? See full size image here
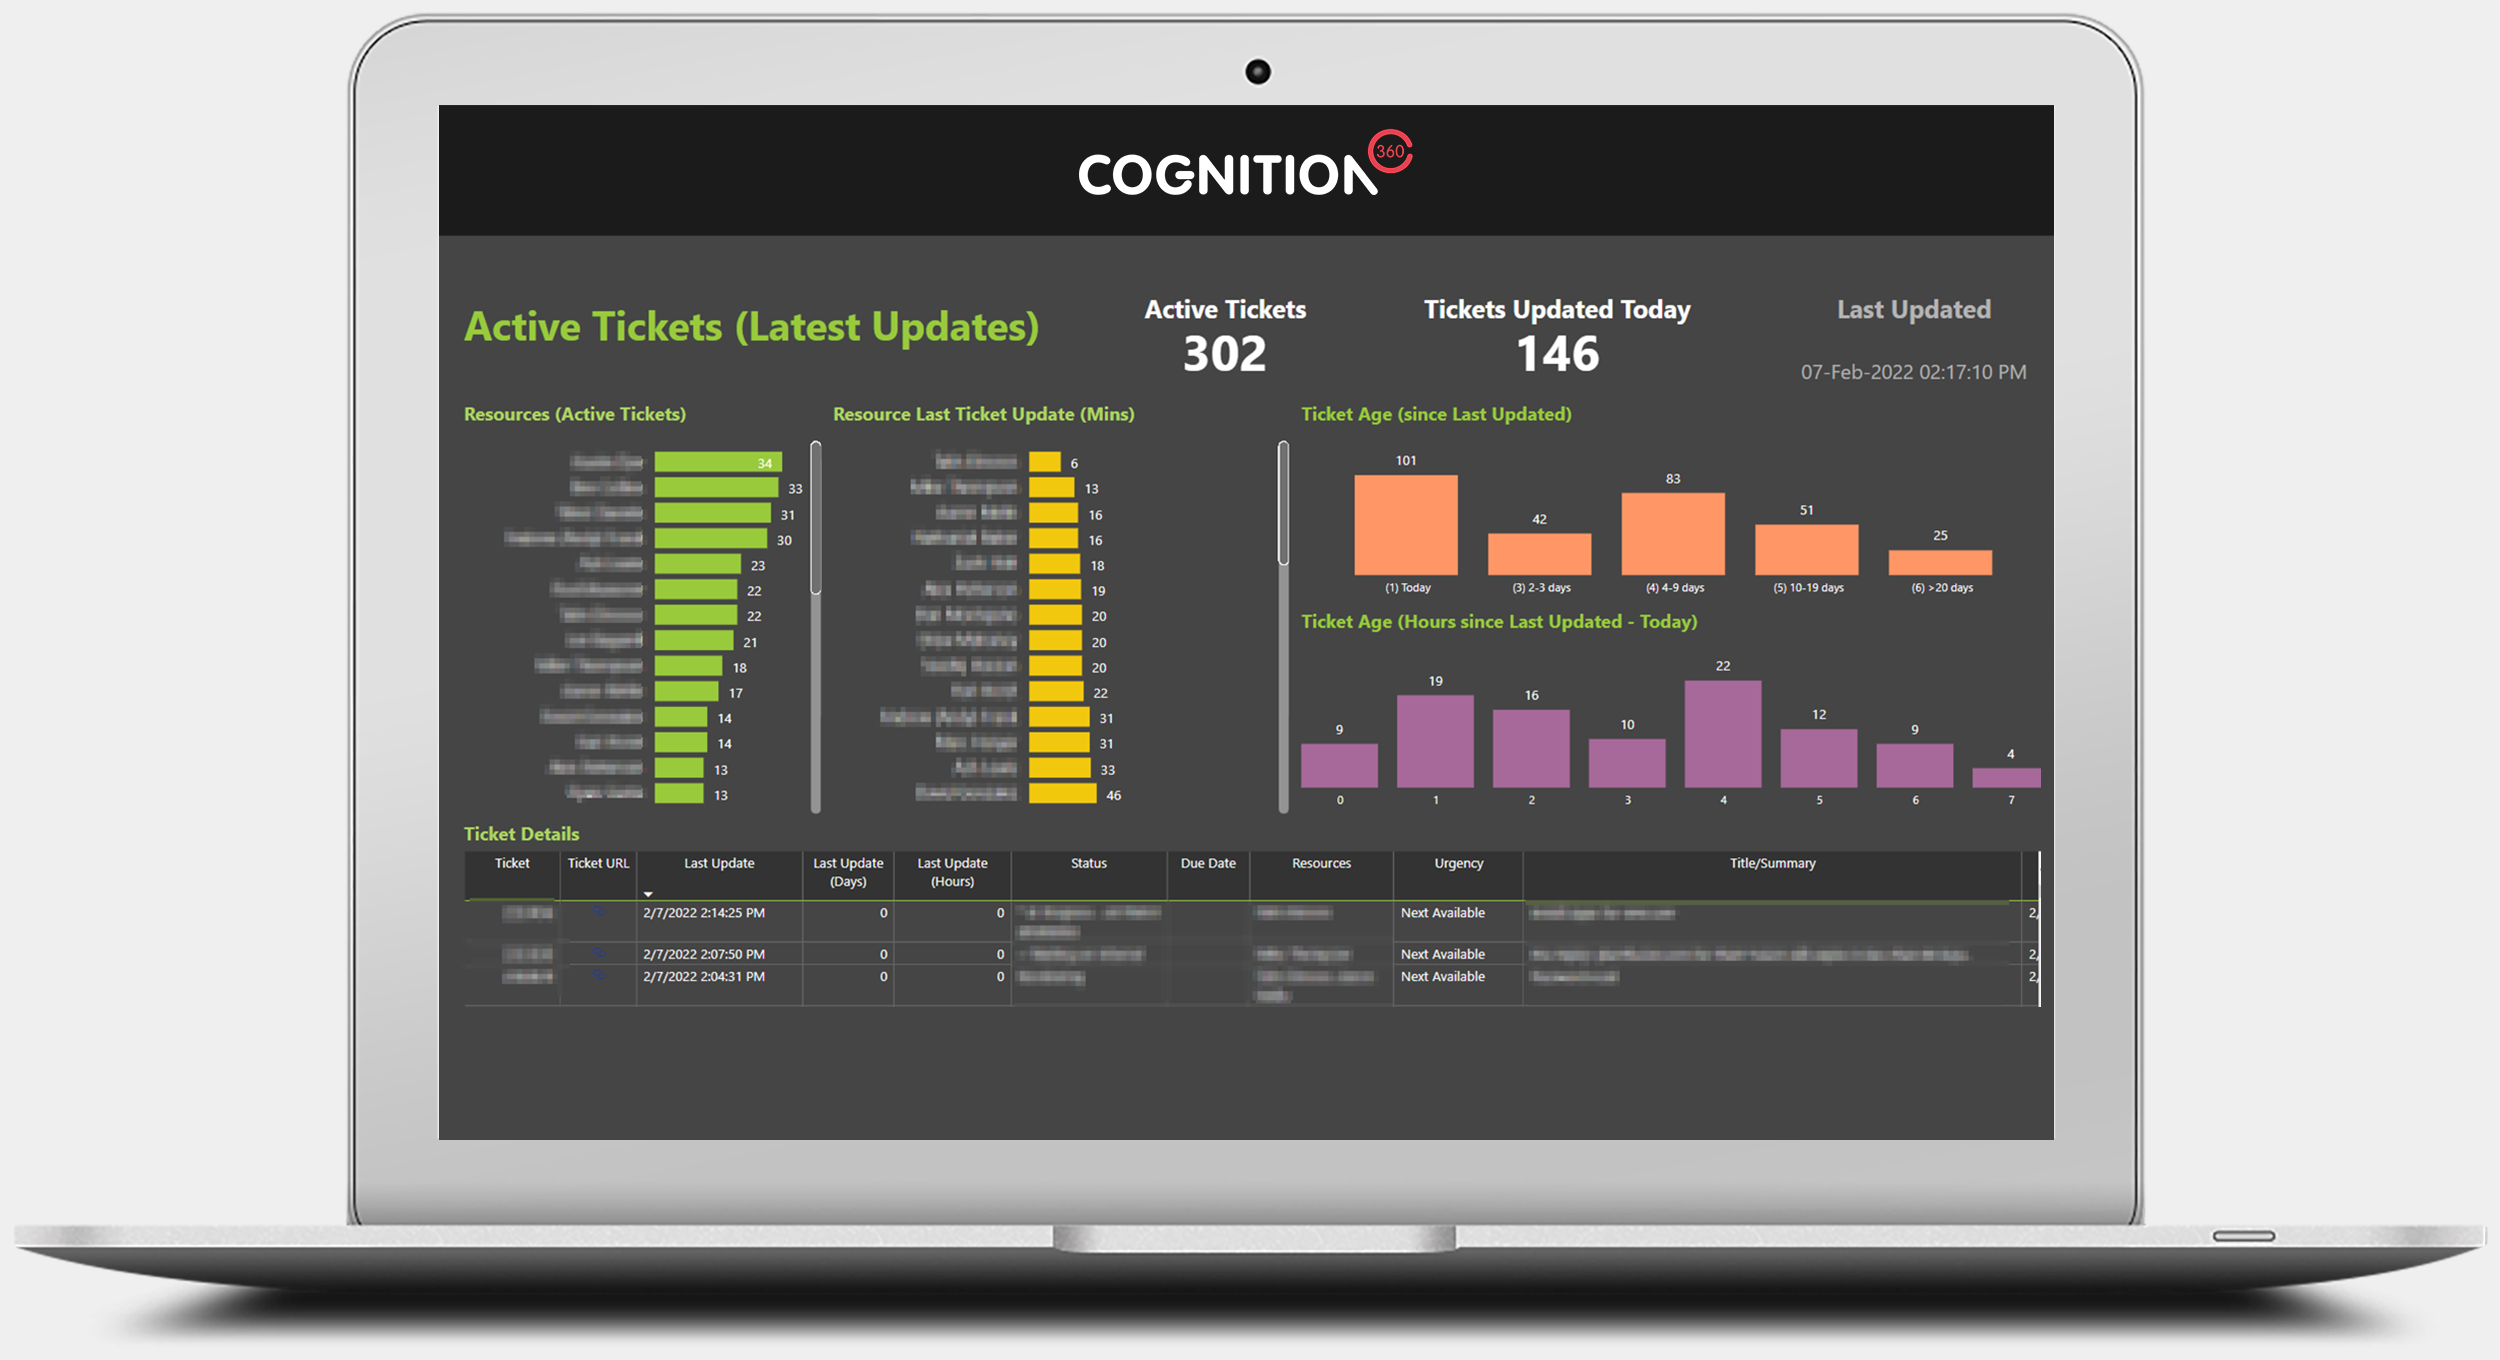
Active Tickets: Latest Updates
Review ticket activity by resource/technician. See the tickets each resource is working on today. Metrics shown for the minutes since last ticket updated and tickets updated today.
Report page also shows historical active ticket updates for the resource. Allows you to see the volume of active tickets not worked on today for the resources on the tickets.
(Number of report views shown: 1)
Image too small? See full size image here
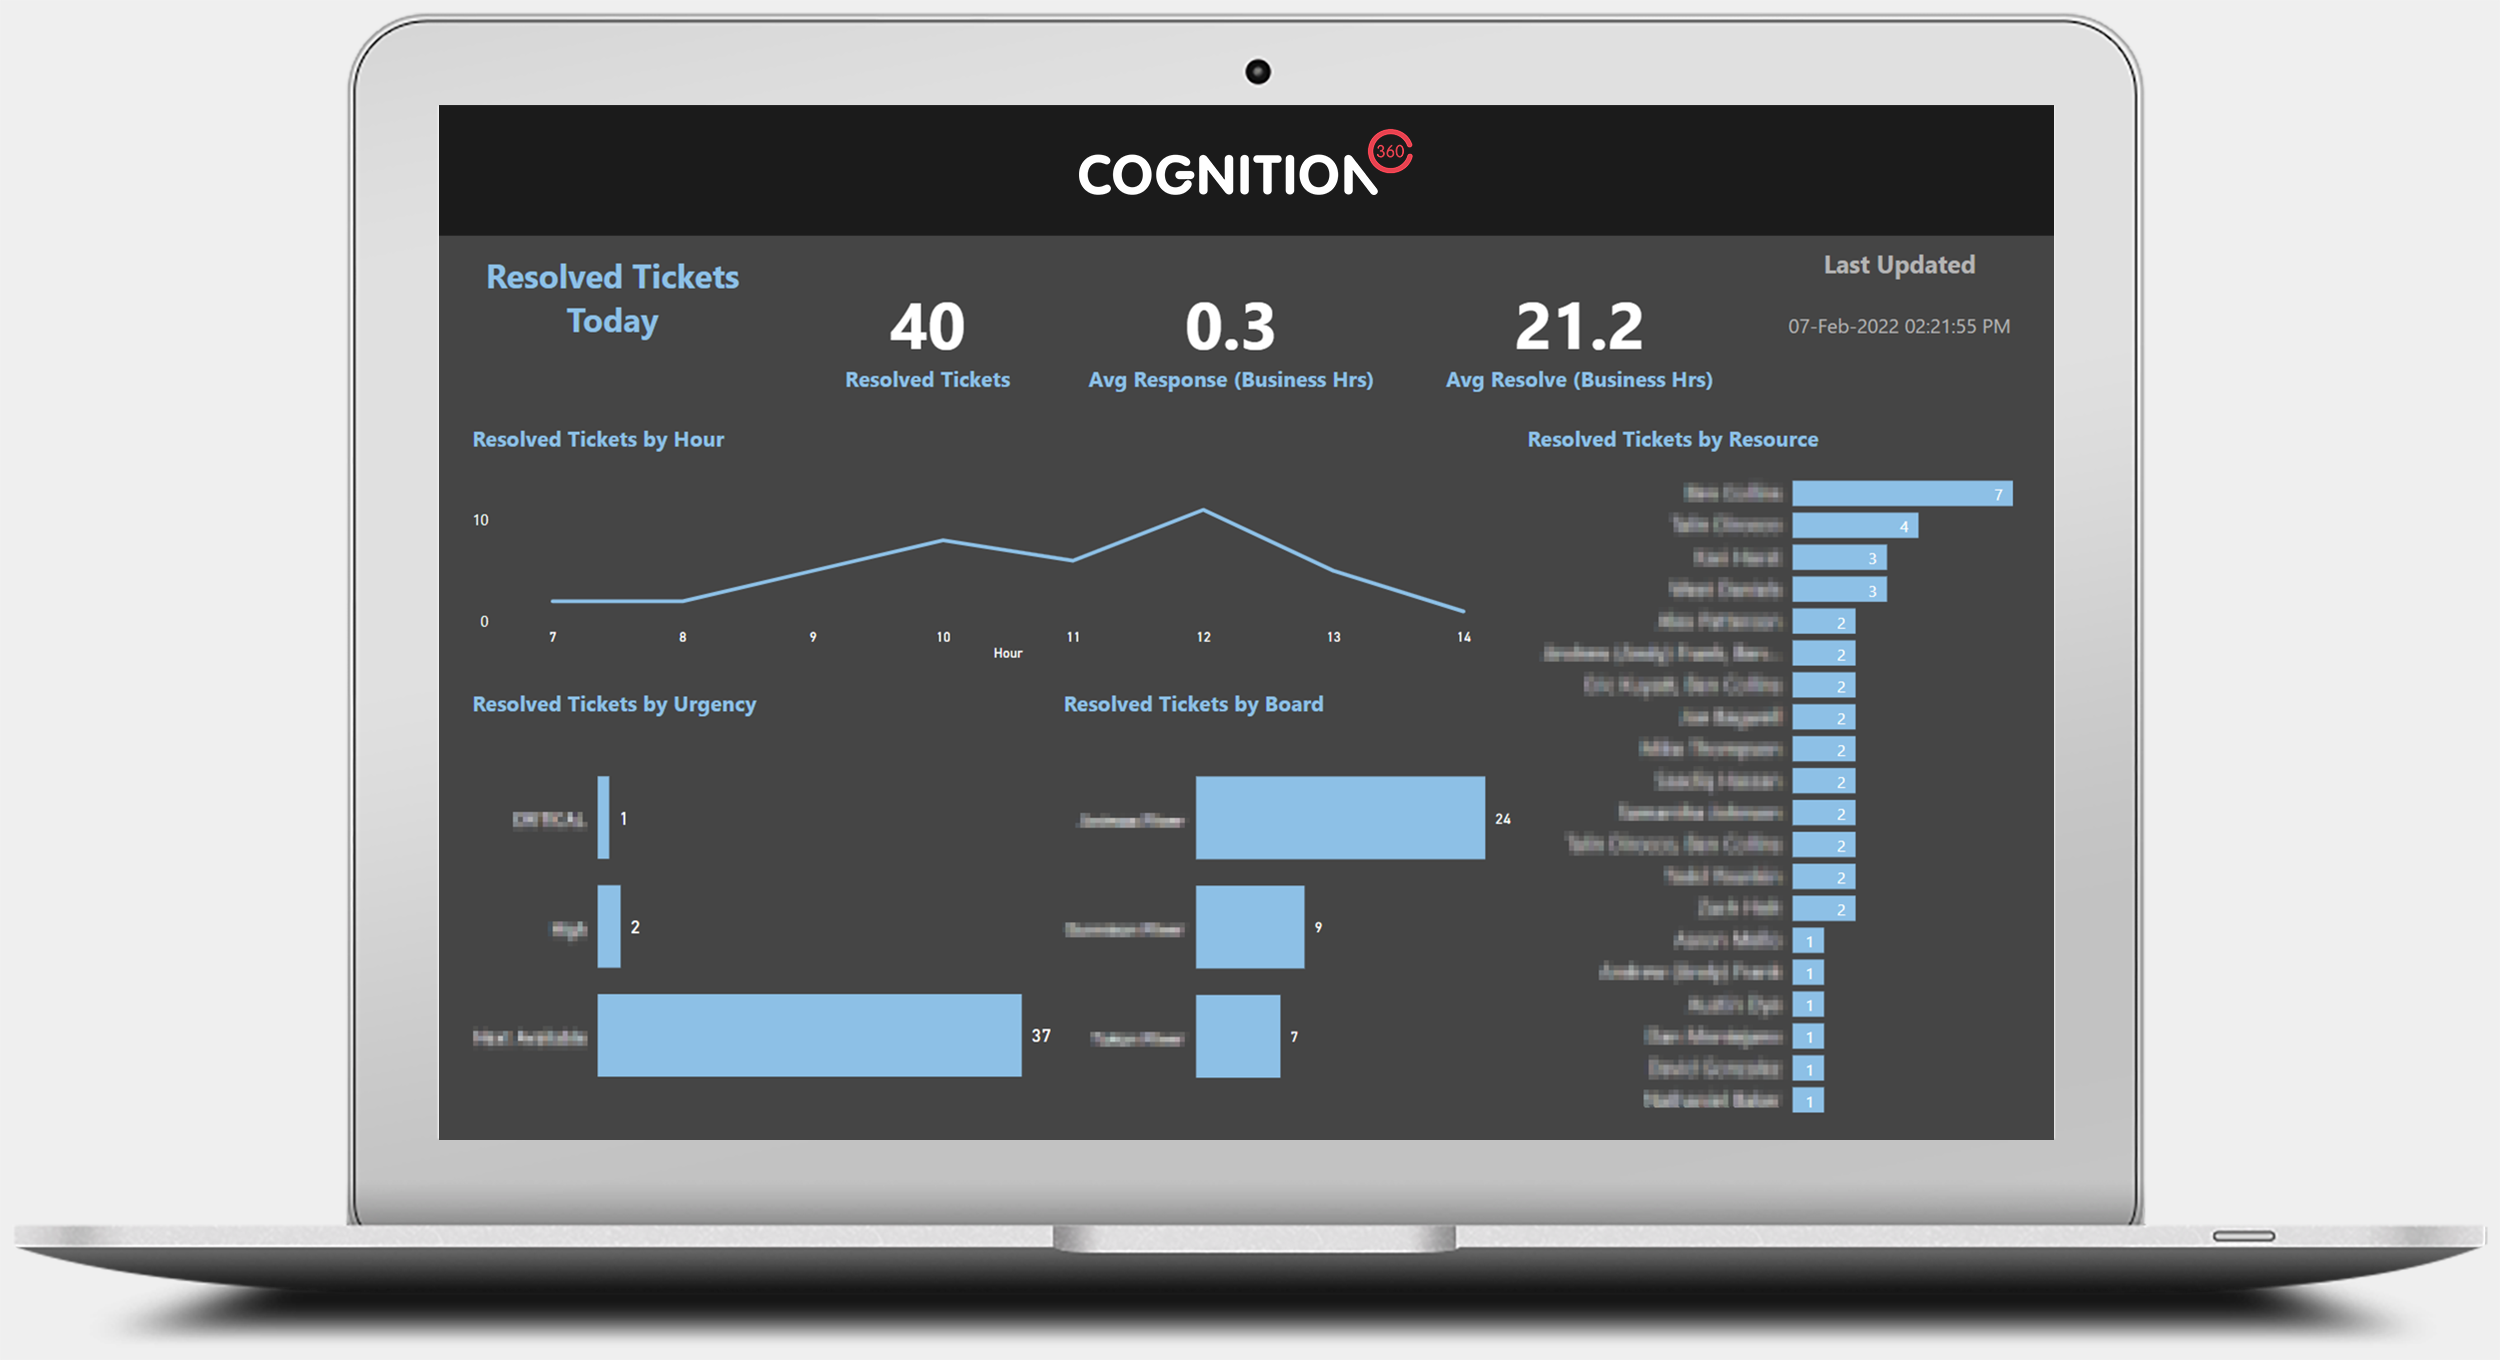
Resolved Tickets: Today
Review tickets resolved today. Filter by board, technician/resource, or ticket urgency/priority. Report shows timeline of resolved tickets by hour and response and resolution times.
(Number of report views shown: 1)
Image too small? See full size image here
November 2021
Sales Reports
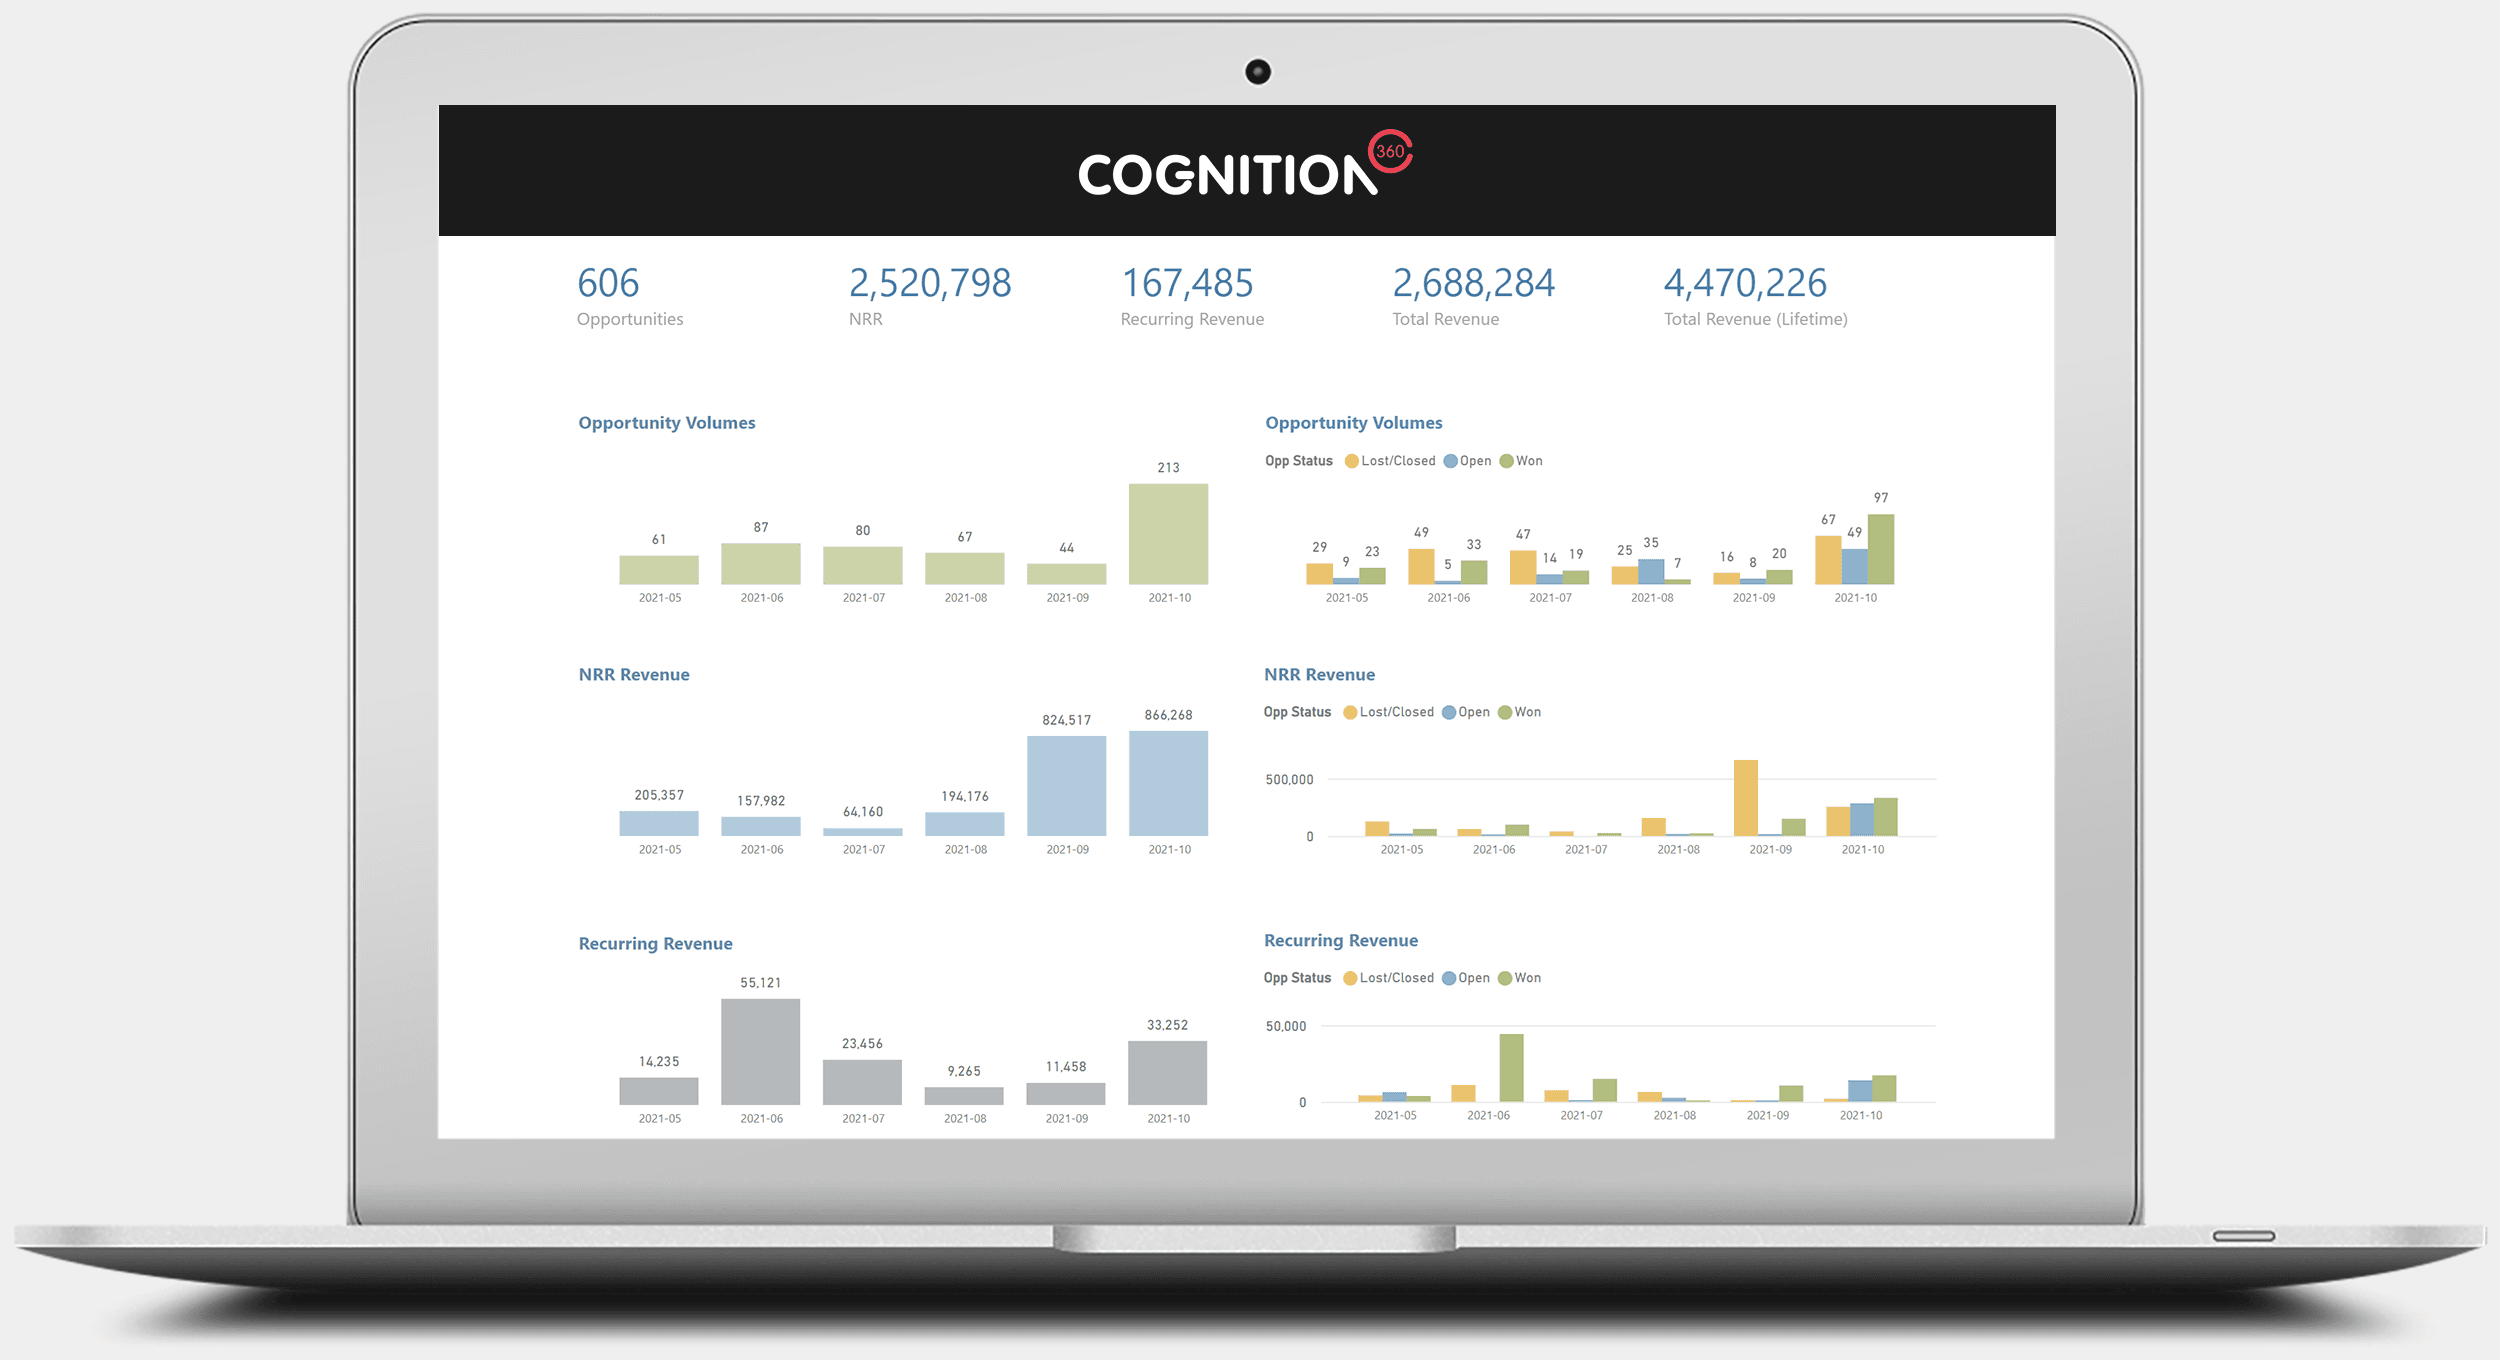
See some screenshots of the Sales report and views below. Get in touch if you’d like to know more about this report for your business.
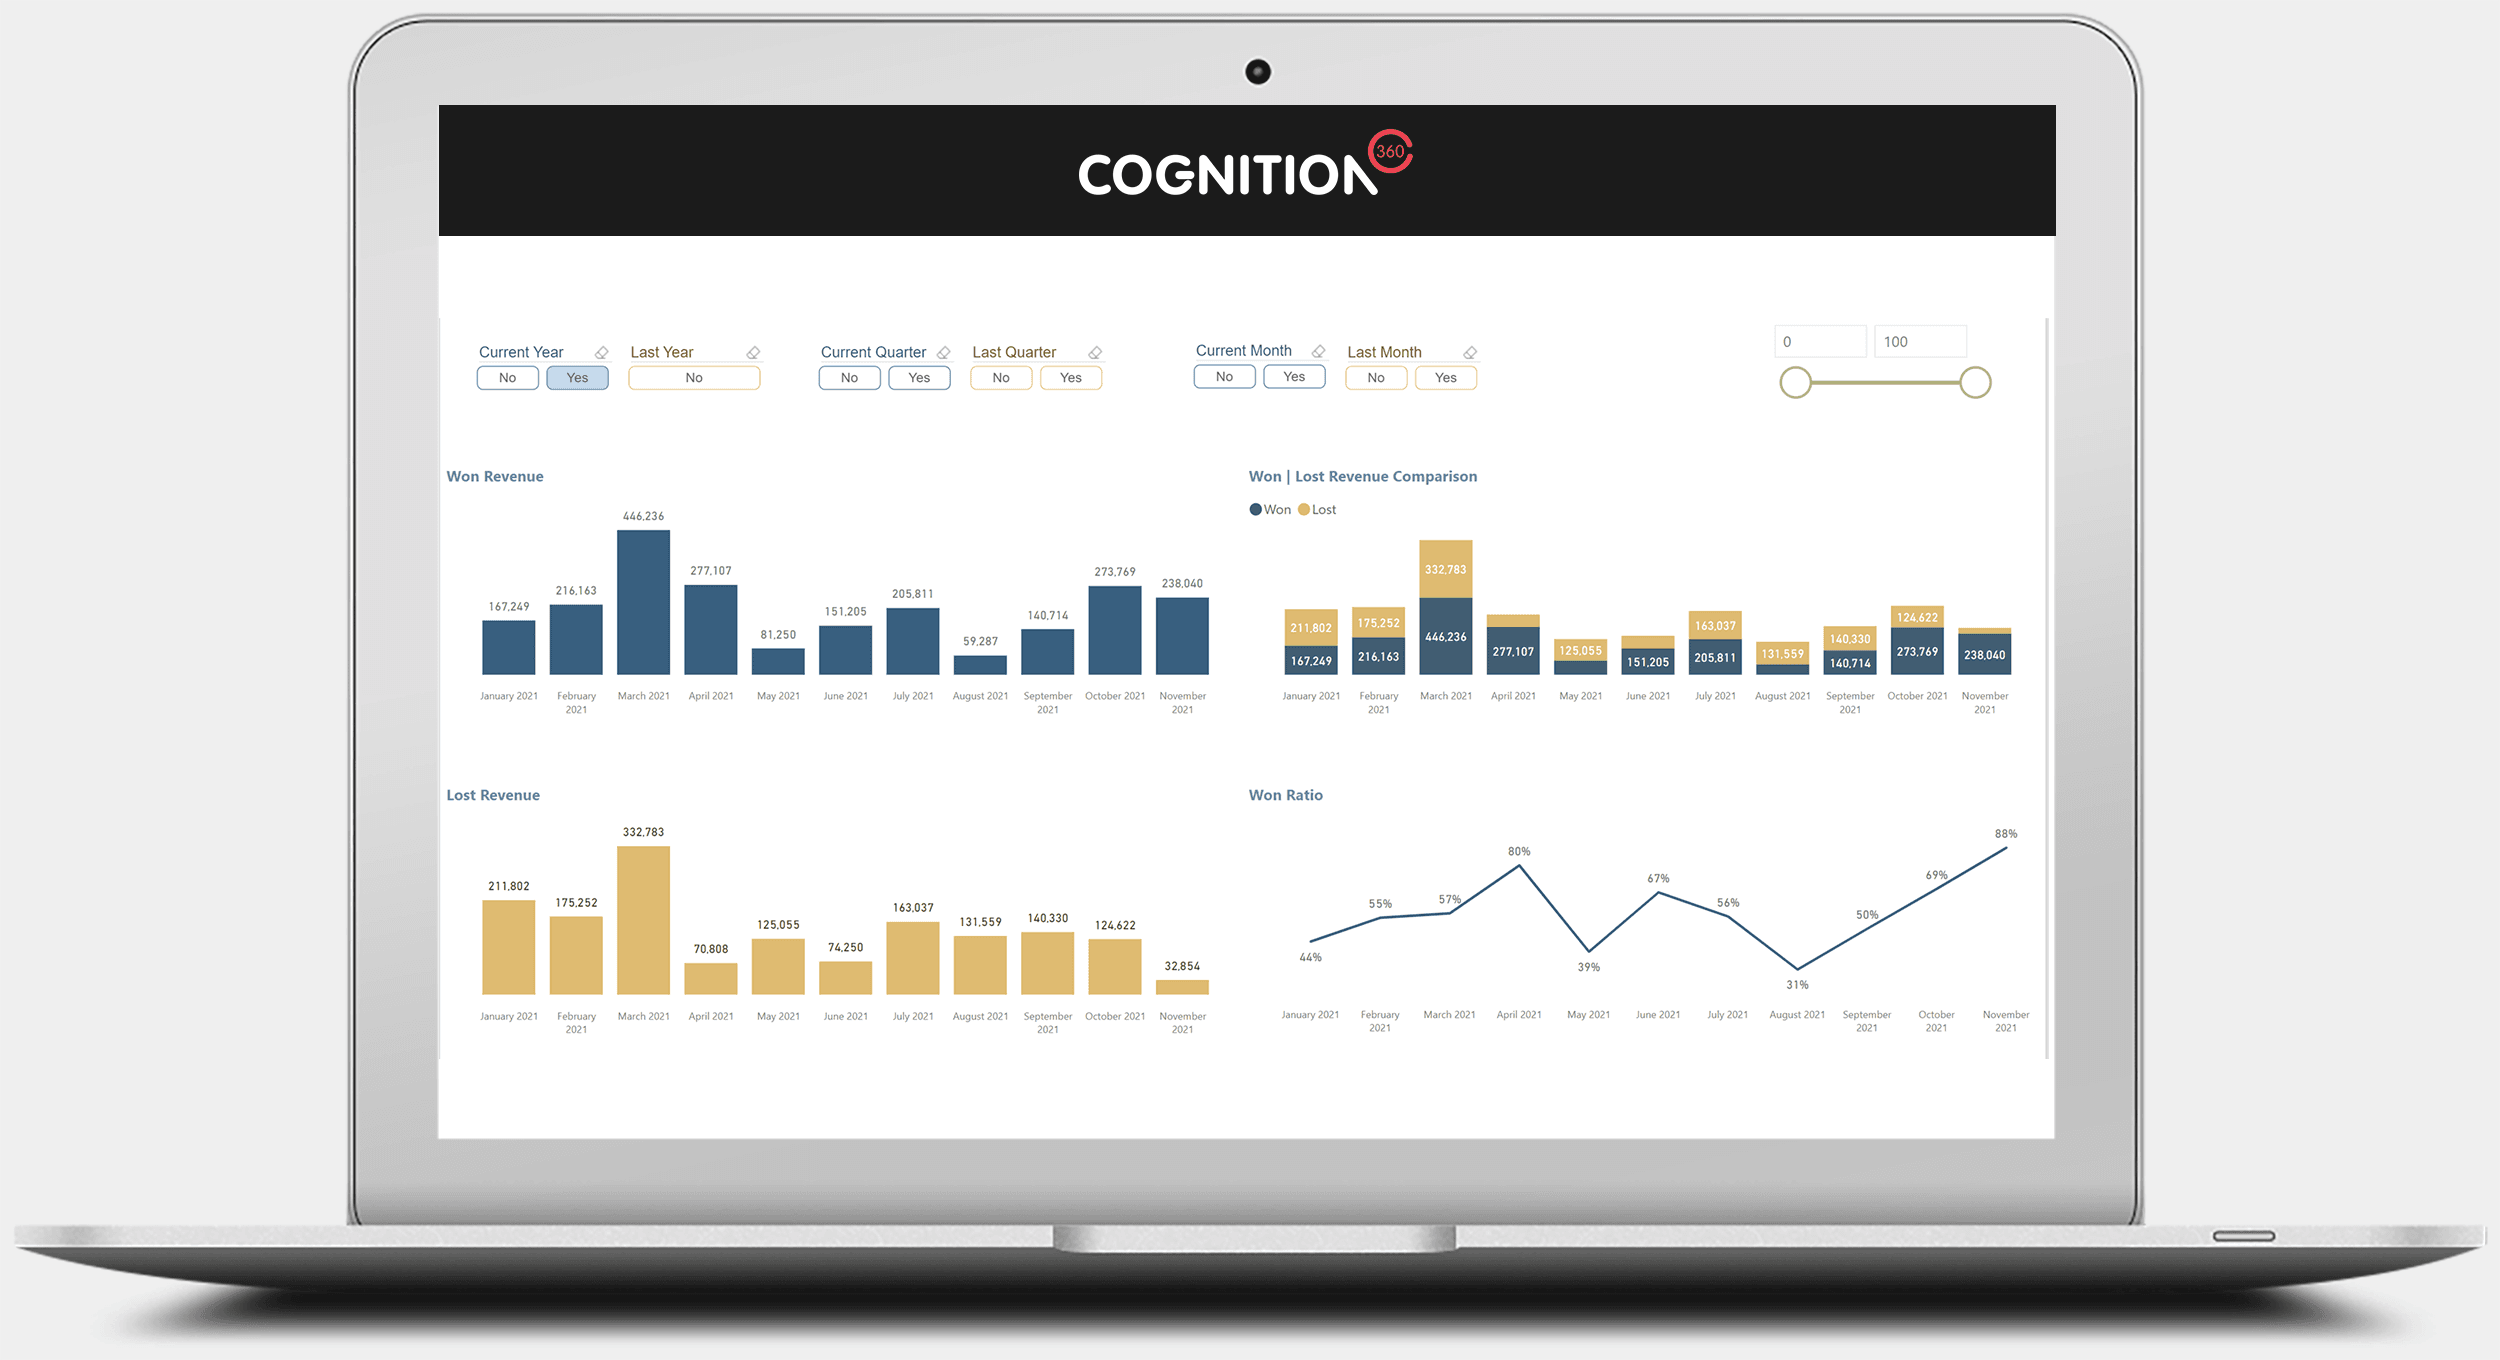
Sales Opportunities Won/Lost
Sales Opportunity Won and Lost information. Review month on month data for won and lost opportunities. Adjust by Probability score to analyze lost opportunities. On-page filters for quick navigation to last/current year, quarter and month.
(Number of report views shown: 1)
Image too small? See full size image here
Sales Opportunity Data by Month/Status
View opportunity data by month created and status of the opportunity. See current and historical data, how many opportunities are still open, etc.
(Number of report views shown: 1)
Image too small? See full size image here
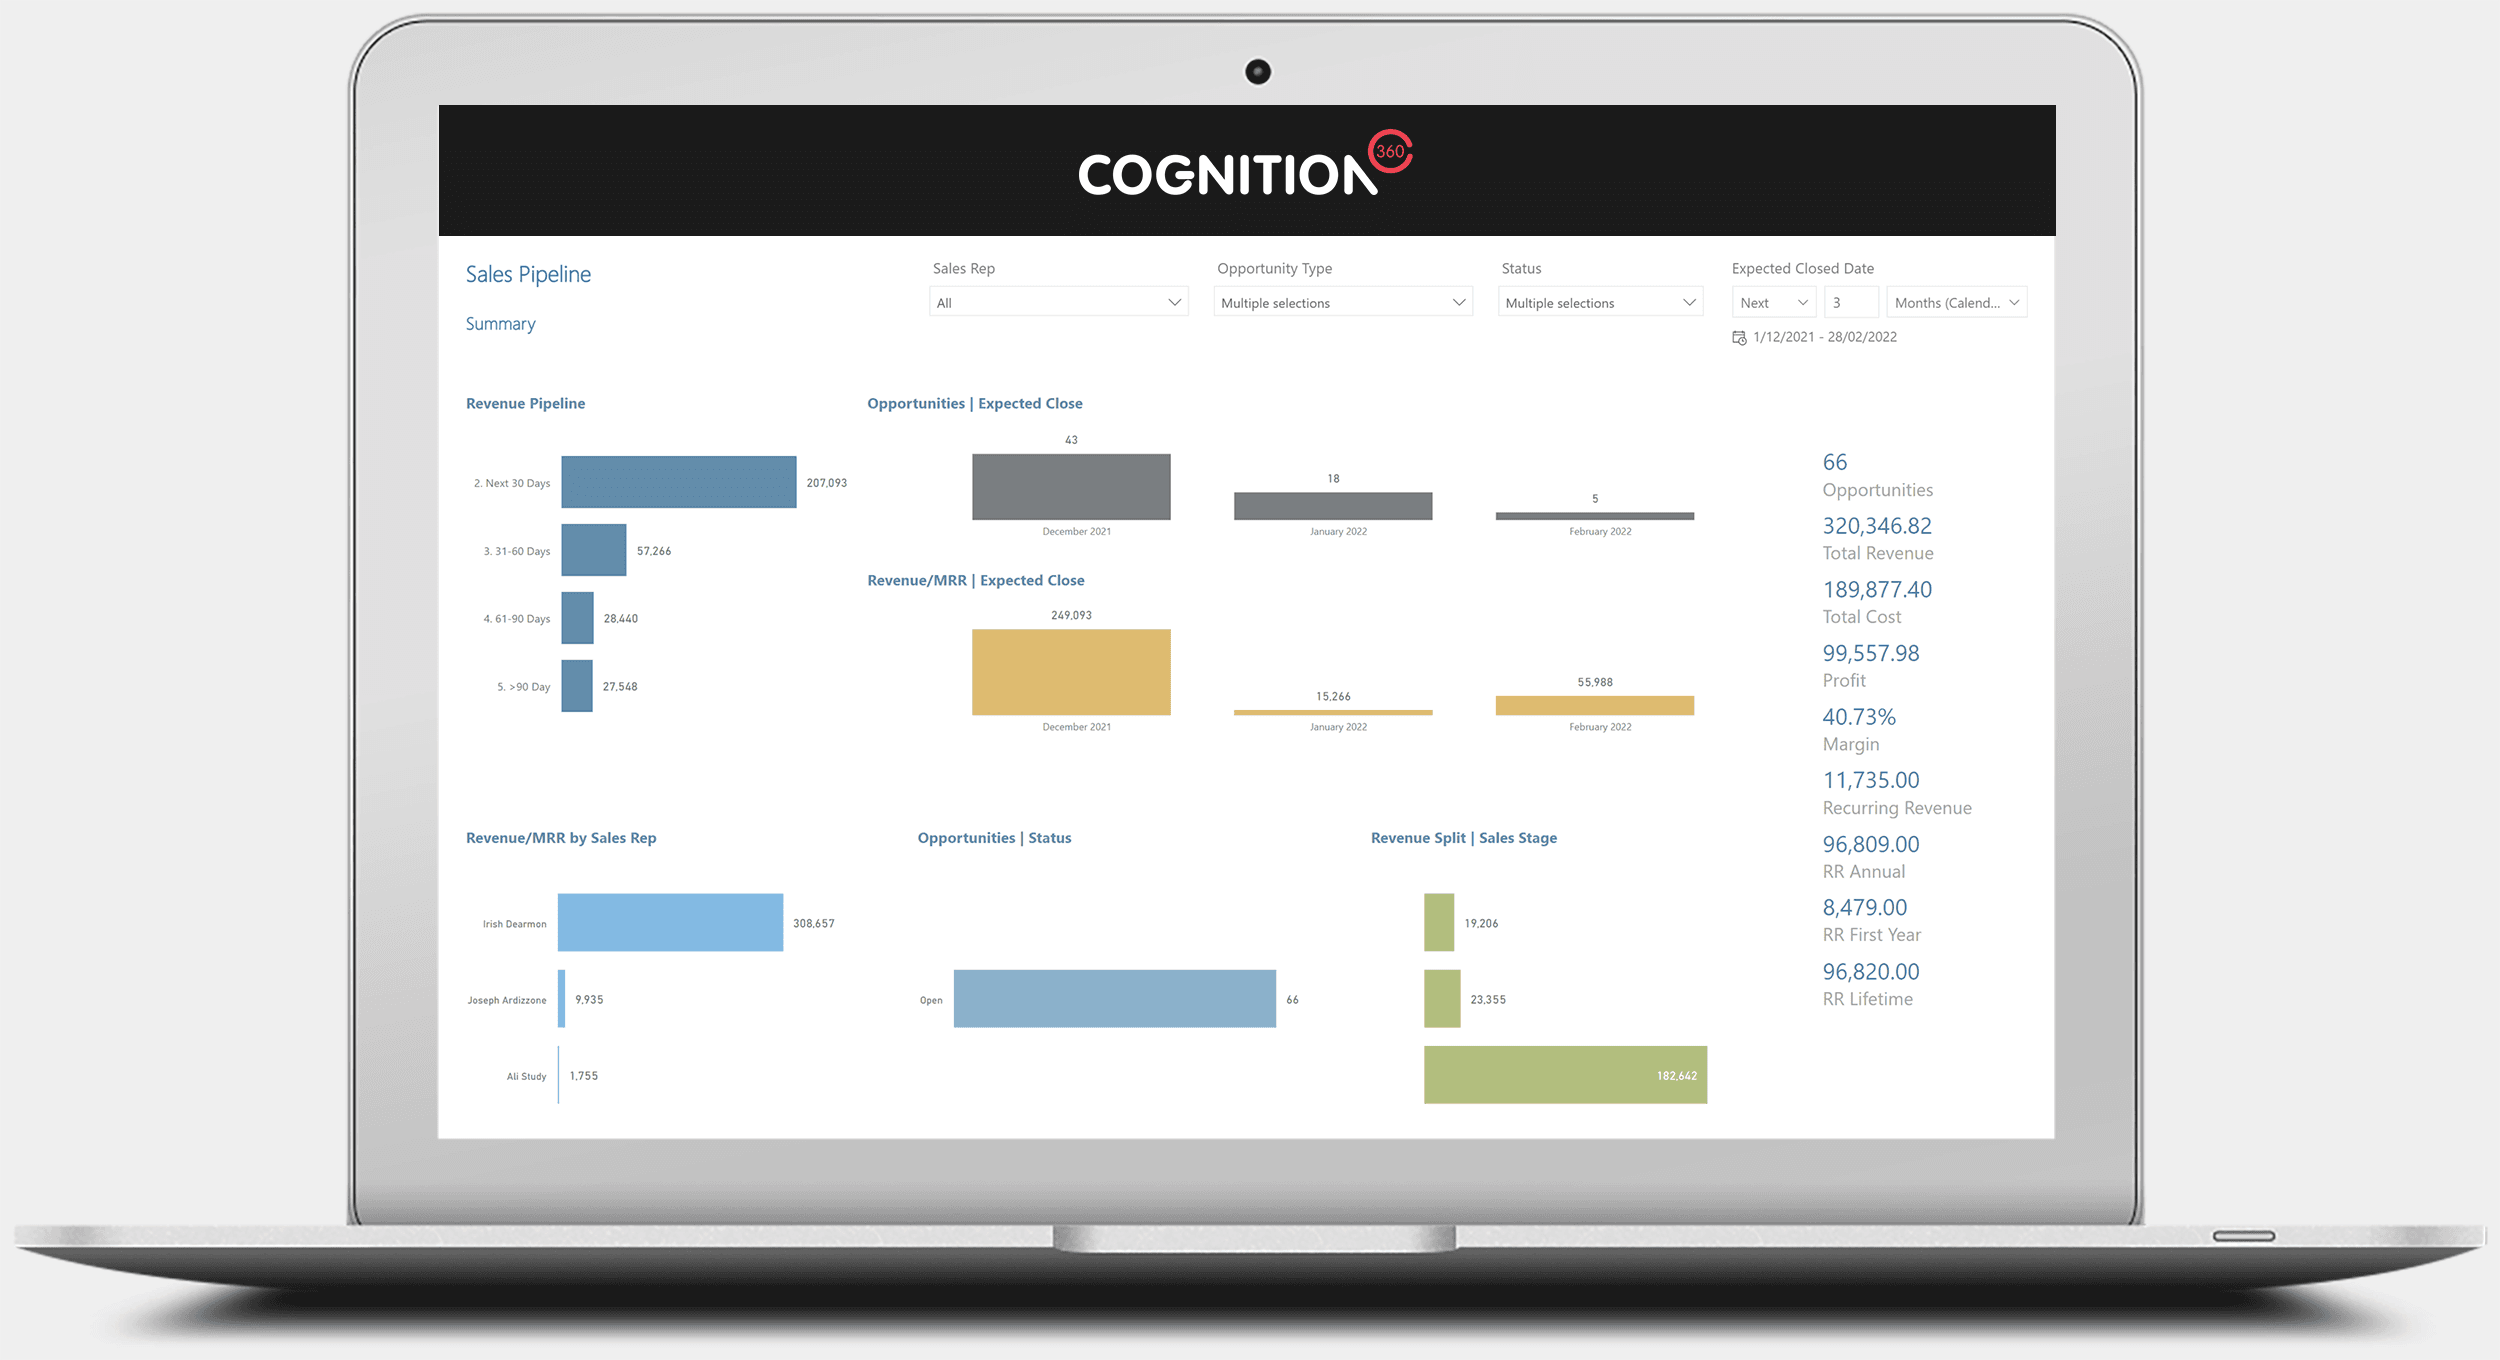
Sales Pipeline
Sales pipeline data showing funnel for the next 90 days. See opportunity revenue per month, per sales rep and per sales stage.
(Number of report views shown: 1)
Image too small? See full size image here
OCTOBER 2021
Agreement Profitability Report Enhancements
Latest enhancements to our Agreement Profitability Report include: the ability to split invoices by agreement and see parent and child agreement profit separately, view month over month revenue changes, and track profit by margin and contribution rate.
See some screenshots of the redeveloped reports and views below. Get in touch if you’d like to know more about this report for your business.
Agreement Profitability by Agreement Type
Agreement profit by Agreement Type, with trending for Margin, Effective Rate and Contribution Rate.
(Number of report views shown: 1)
Image too small? See full size image here
Agreement Profitability per Agreement
View profitability per agreement. Data for billing is shown at the agreement level. This allows profitability for each agreement to be shown even when the agreement is not the main agreement on the ConnectWise Manage invoice – for example, parent and child agreements will be shown separately.
(Number of report views shown: 1)
Image too small? See full size image here
Agreement Profitability – All Customer Agreements
Alternatively, view all customer agreements together. This view allows for parent and child agreements to be rolled up into one profitability view.
(Number of report views shown: 1)
Image too small? See full size image here
Effective Hourly Rate
View Effective Hourly Rate for all, top segment, or bottom segment of agreements. A similar view is also available for Contribution Rate.
(Number of report views shown: 1)
Image too small? See full size image here
Margin on Agreements
View margin on agreements month over month. See trends in the data and drill through further to labor data on agreement. To identify potential causes of reductions or increases in margins.
(Number of report views shown: 1)
Image too small? See full size image here
Invoice Data
Review invoice data on agreements. See month on month invoiced amounts, changes for both value and percentage.
(Number of report views shown: 1)
Image too small? See full size image here
SEPTEMBER 2021
Technology Business Review Reporting
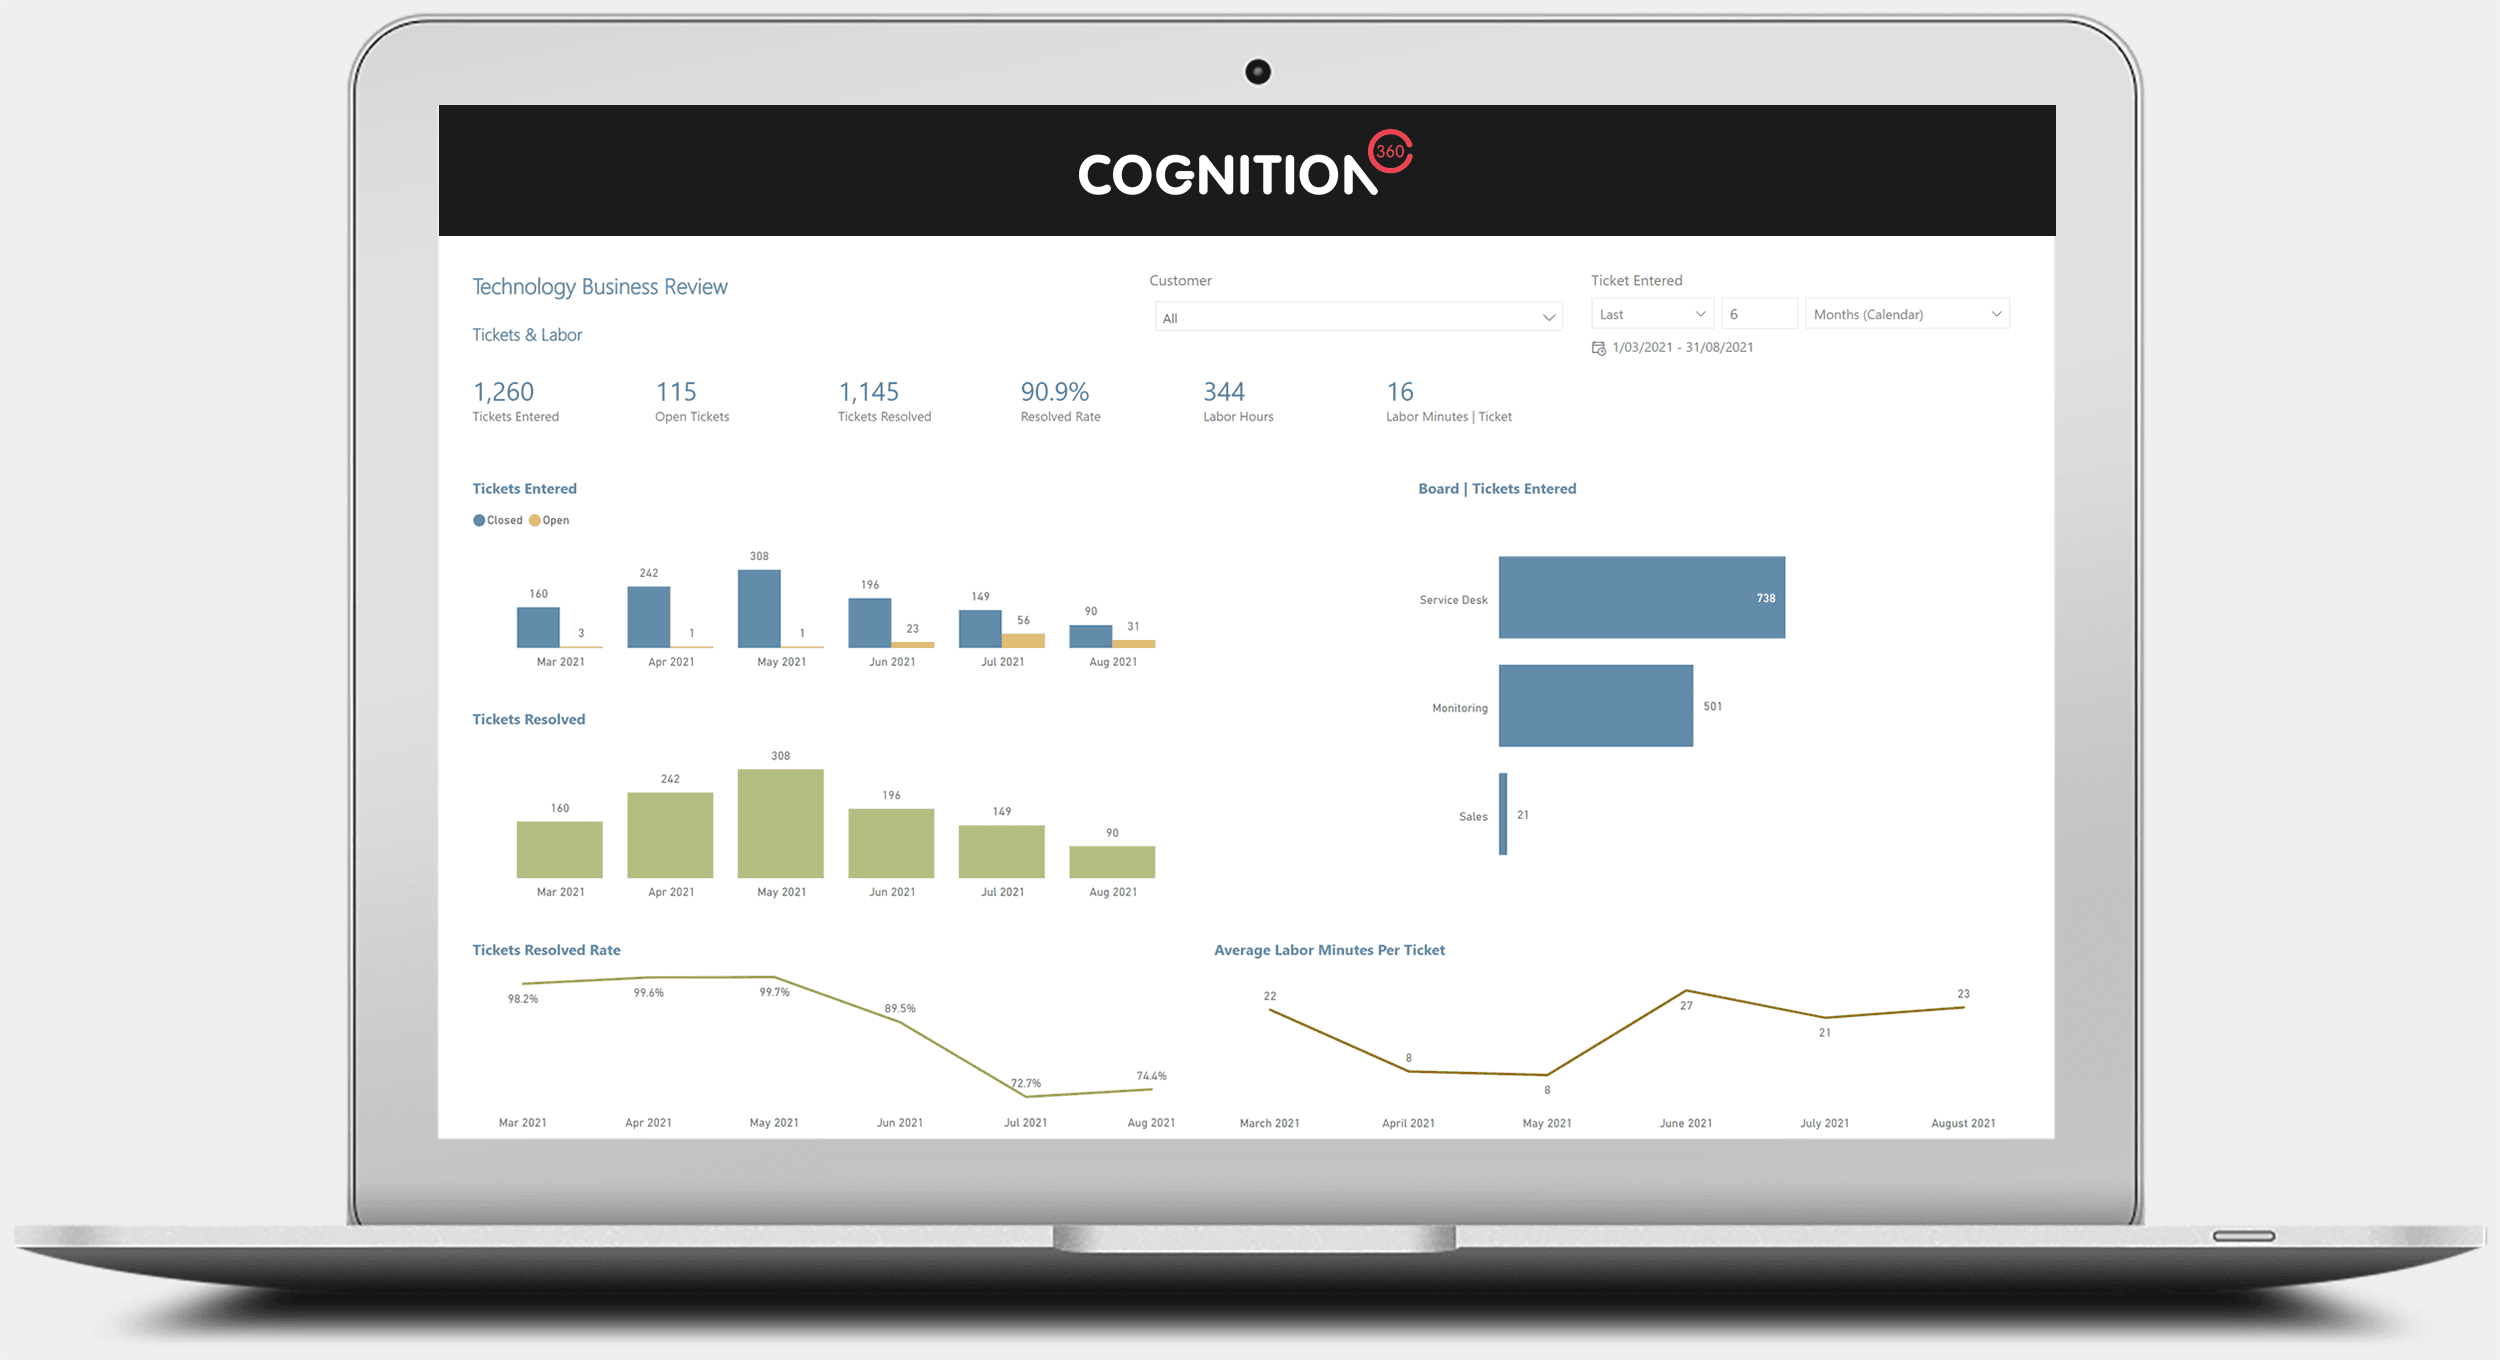
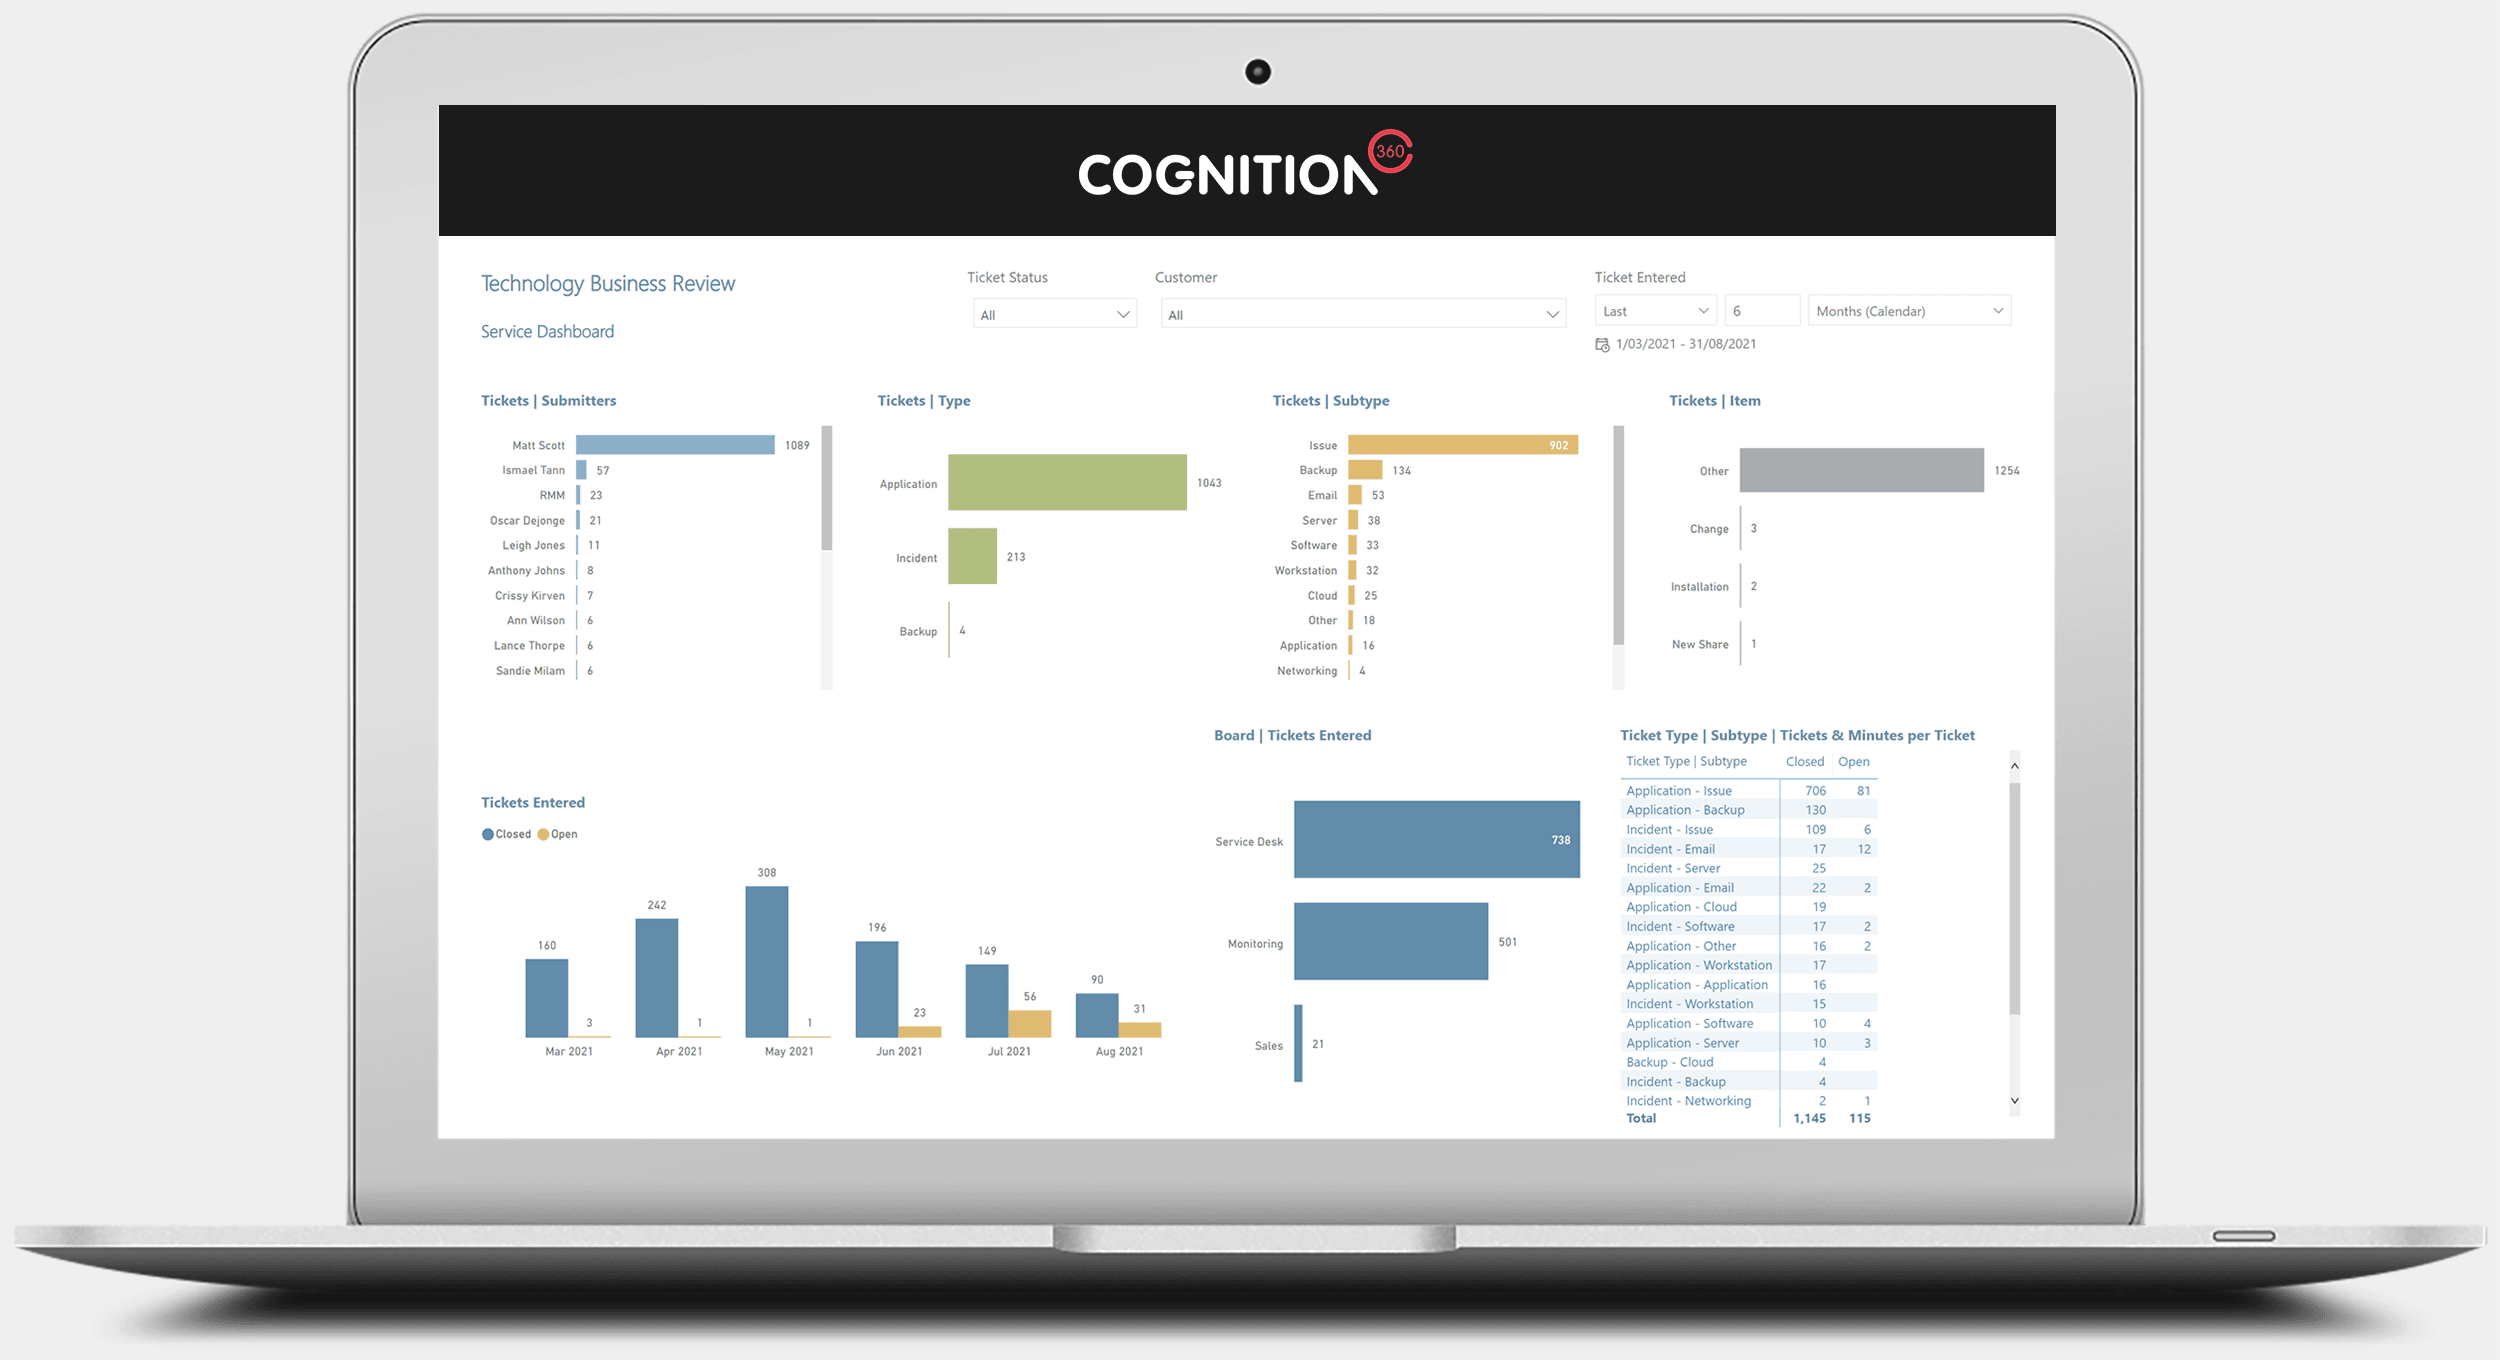
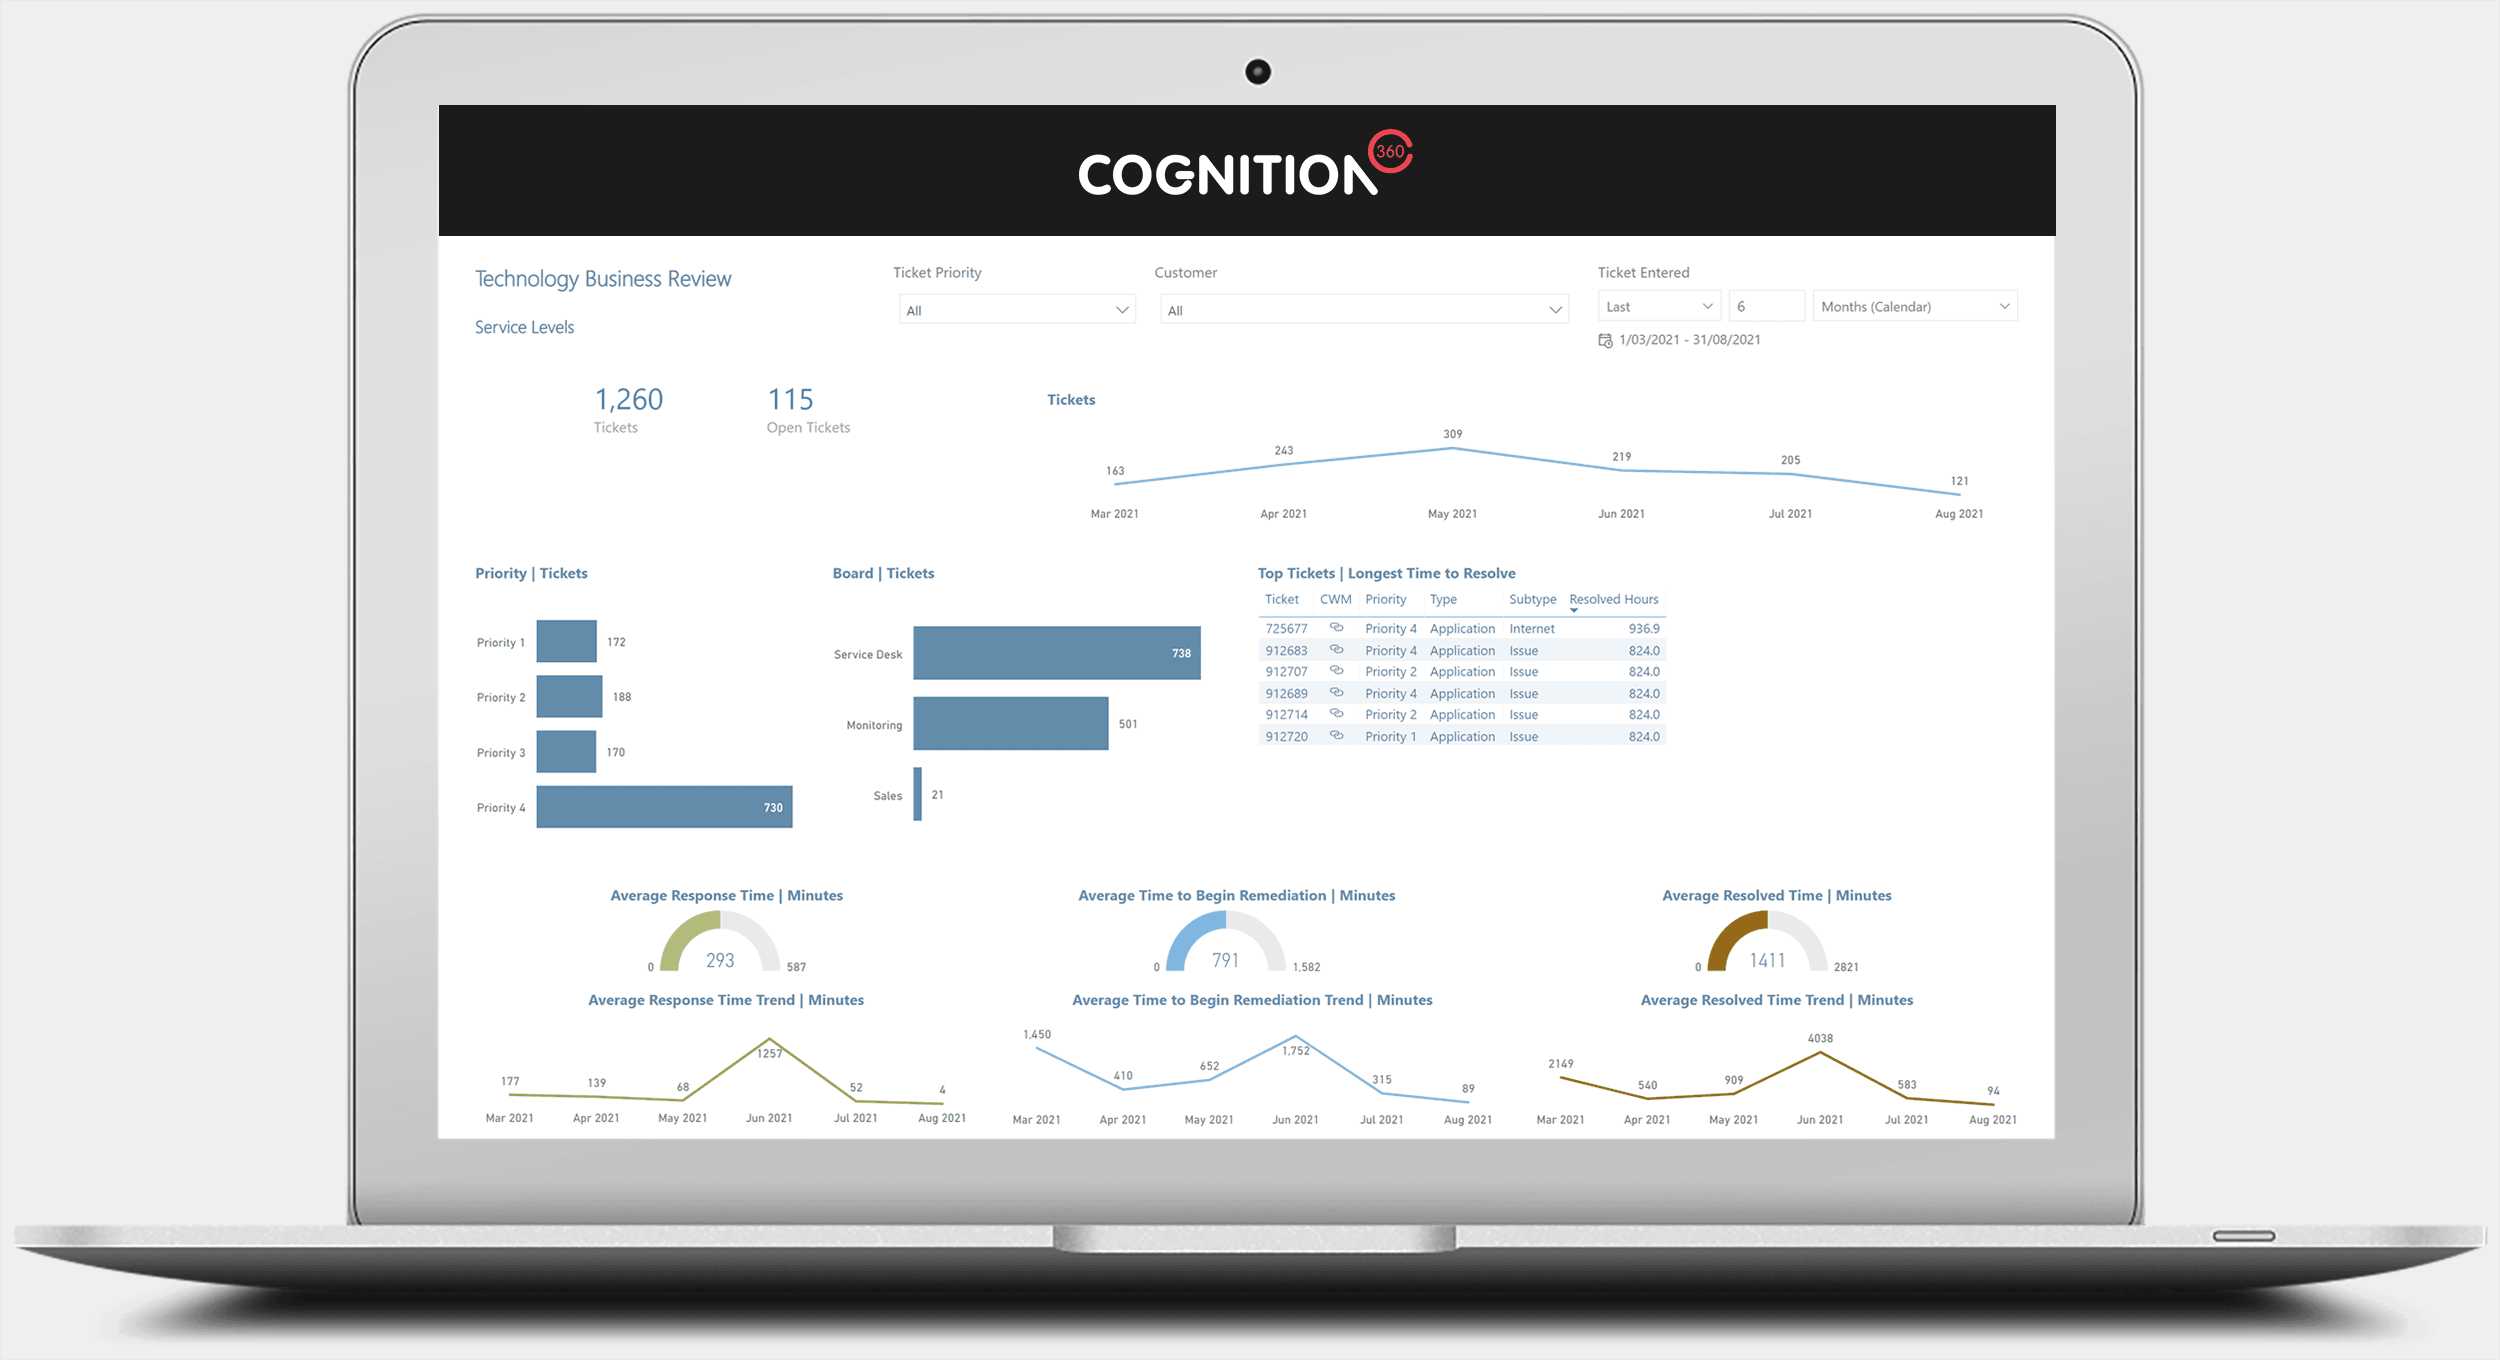
We have significantly redeveloped our Technology Business Review reports and views, based on feedback from our users. We’re delivering a Technology Business Review reporting template that works right out of the box, but which also allows for fast and easy customization to fit your individual business needs. A particular strength is the ease with which you can tailor reports to give you deep analytics for internal use, as well as customer-facing reports to drive constructive Technology Business Review conversations with your customers.
See some screenshots of the redeveloped reports and views below and then get in touch if you’d like to know more about this report for your business.
Tickets & Labor
Shows tickets entered and resolved over the selected period. See which boards tickets are recorded on and trends on resolve rate and average minutes recorded per ticket.
(Number of report views shown: 1)
Image too small? See full size image here
Service Dashboard
Review ticket information on who is the contact/submitter of tickets. Ticket type, subtype and item ticket counts by board.
(Number of report views shown: 1)
Image too small? See full size image here
Service Levels
Review service levels by ticket priority for response, plan and resolution times.
(Number of report views shown: 1)
Image too small? See full size image here
Other pages/views in the report
Client Satisfaction: shows CSAT data surveys over the selected period, last 90 and 30 days. See CSAT score trends and counts of surveys submitted.
Computer Information: shows device data for workstations and servers. Review operating systems by device and device models.
Ticket KPIs: shows KPI data on tickets for First Contact Resolution, Single and Multiple Technicians on tickets and Reopened tickets.
Agreements: shows client agreements, see month on month agreement addition volumes.
Projects: review Closed and Open projects.
Recommendations: shows Open and Closed data for Opportunities.
Procurement: review products that the client has purchased.
AUGUST 2021
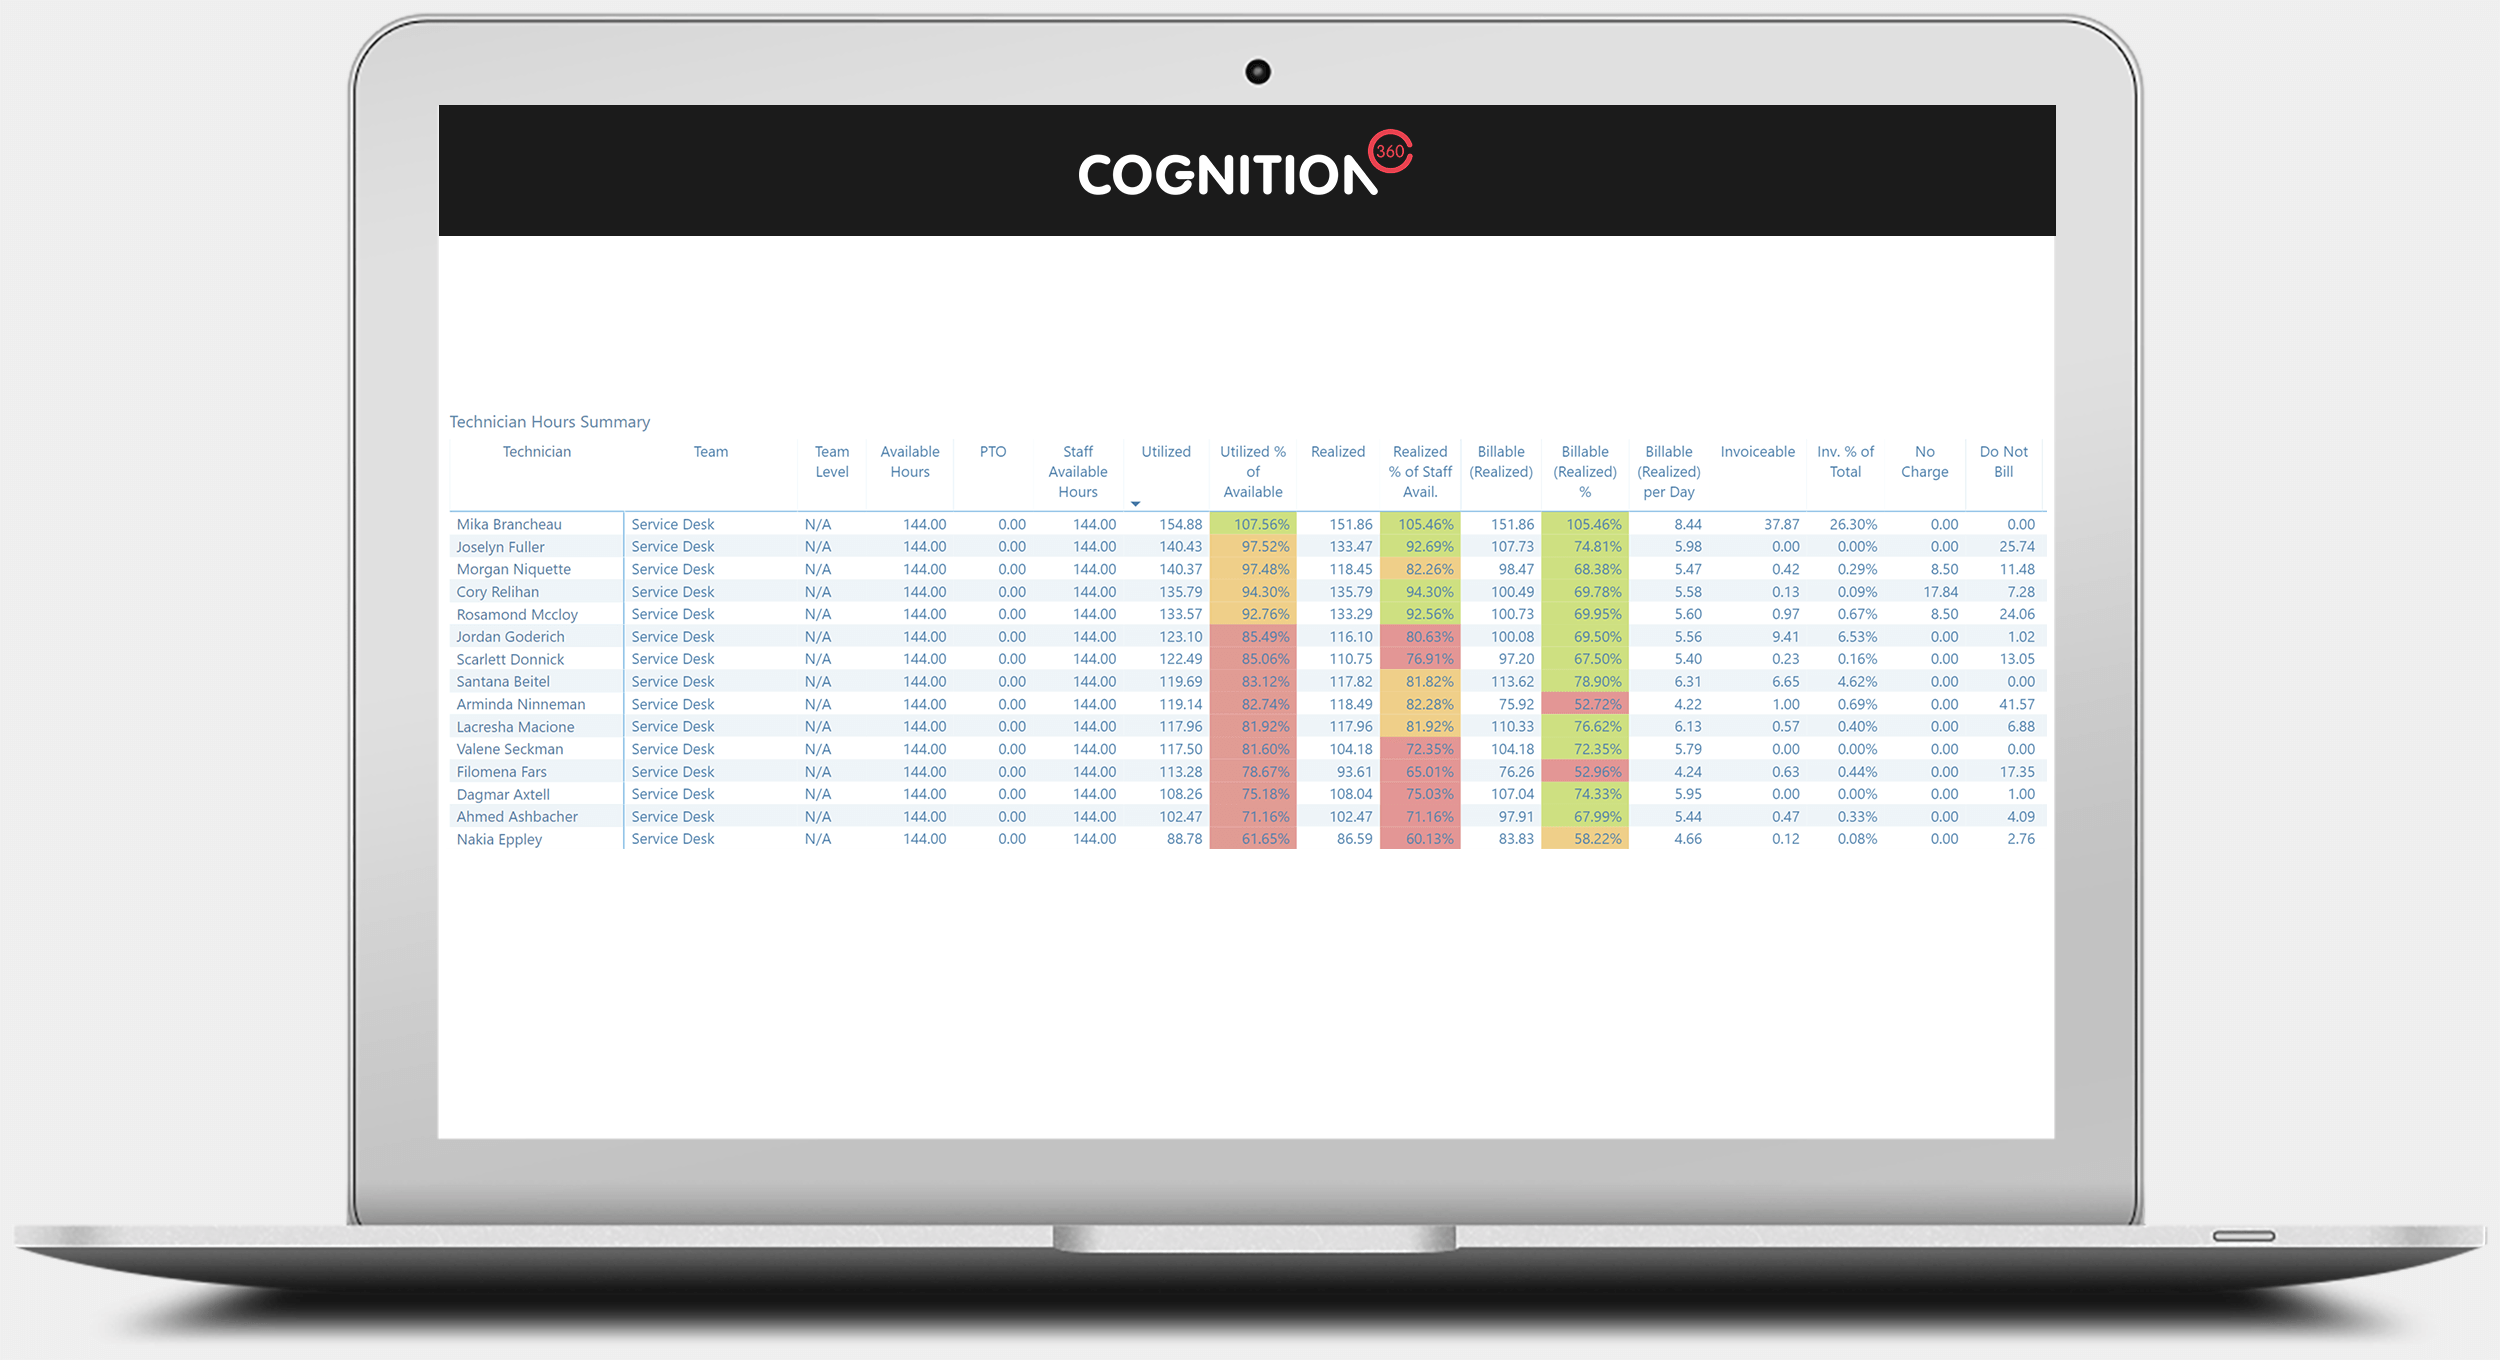
Technician Utilization & Realization
Review time entered to find answers to the following questions: Does it meet the daily capacity of each staff member? Is time recorded against clients or internal? How much time is billable and non-billable?
(Number of report views shown: 1)
Image too small? See full size image here
Technician Efficiency & Performance
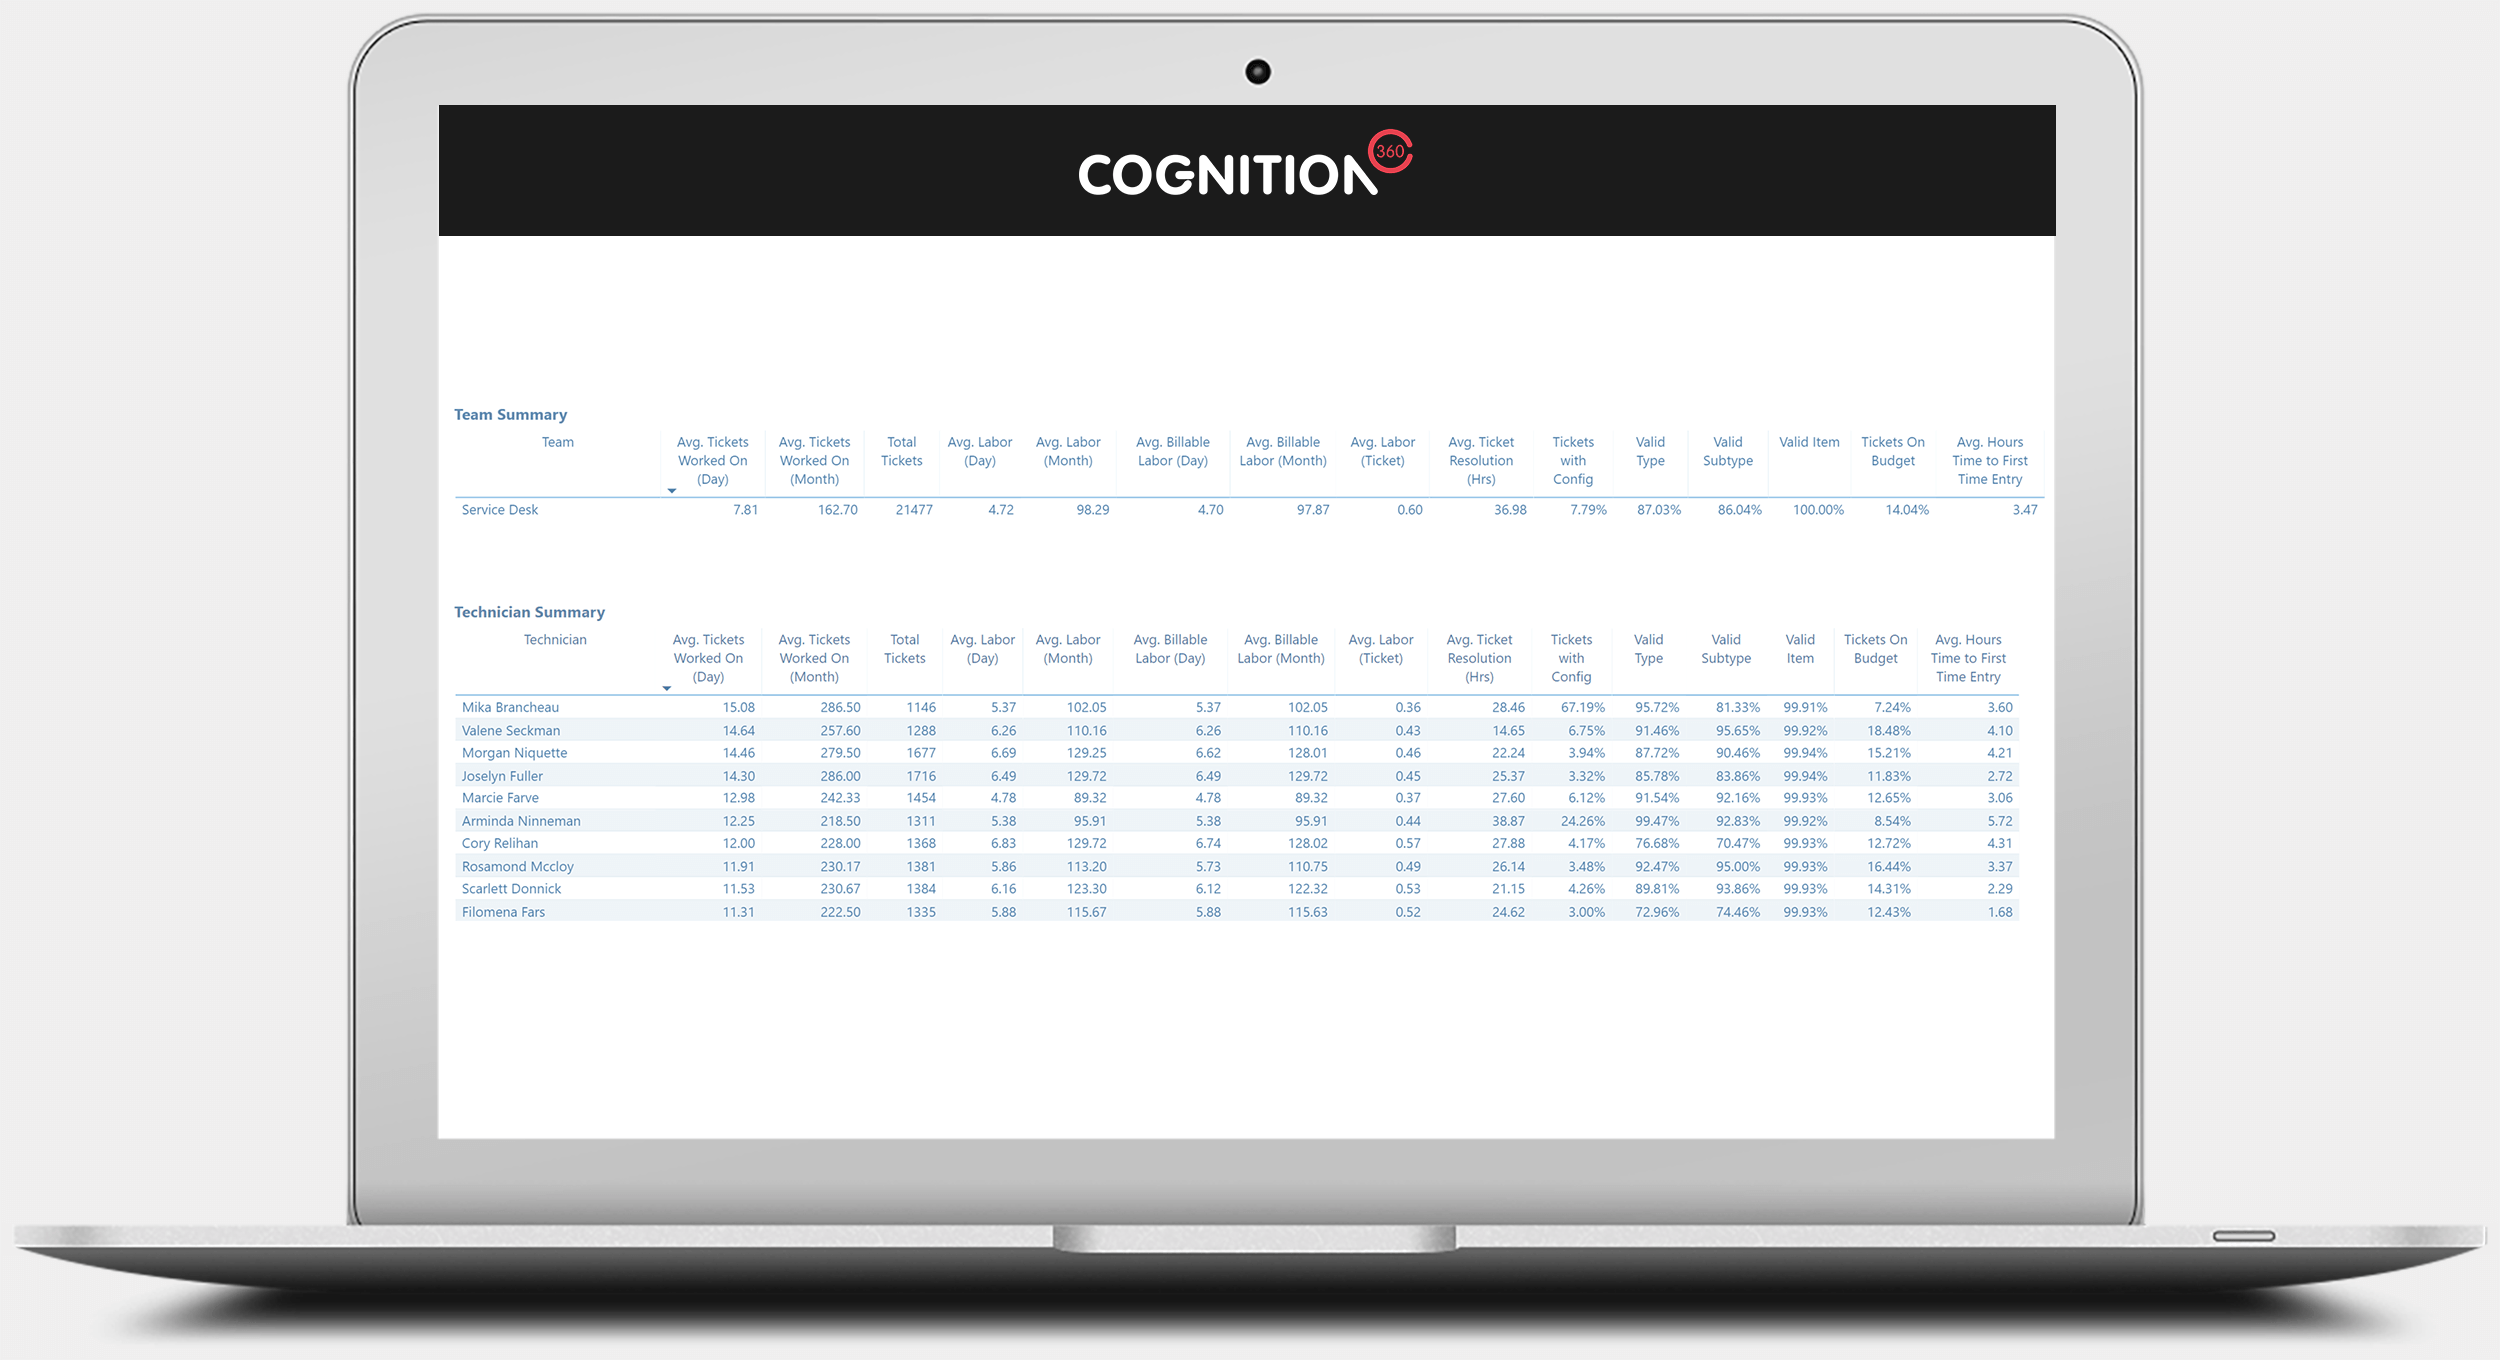
Review the workload of each technician. See each technician’s performance compared across the team per day/month, for the following metrics:
- Tickets worked on (labor recorded)
- Billable labor
- Labor per ticket
- Compliance to recording Ticket Type, Subtype or Item
- How quickly are tickets getting worked on
- MTTR
(Number of report views shown: 1)
Image too small? See full size image here
Schedule Fulfillment
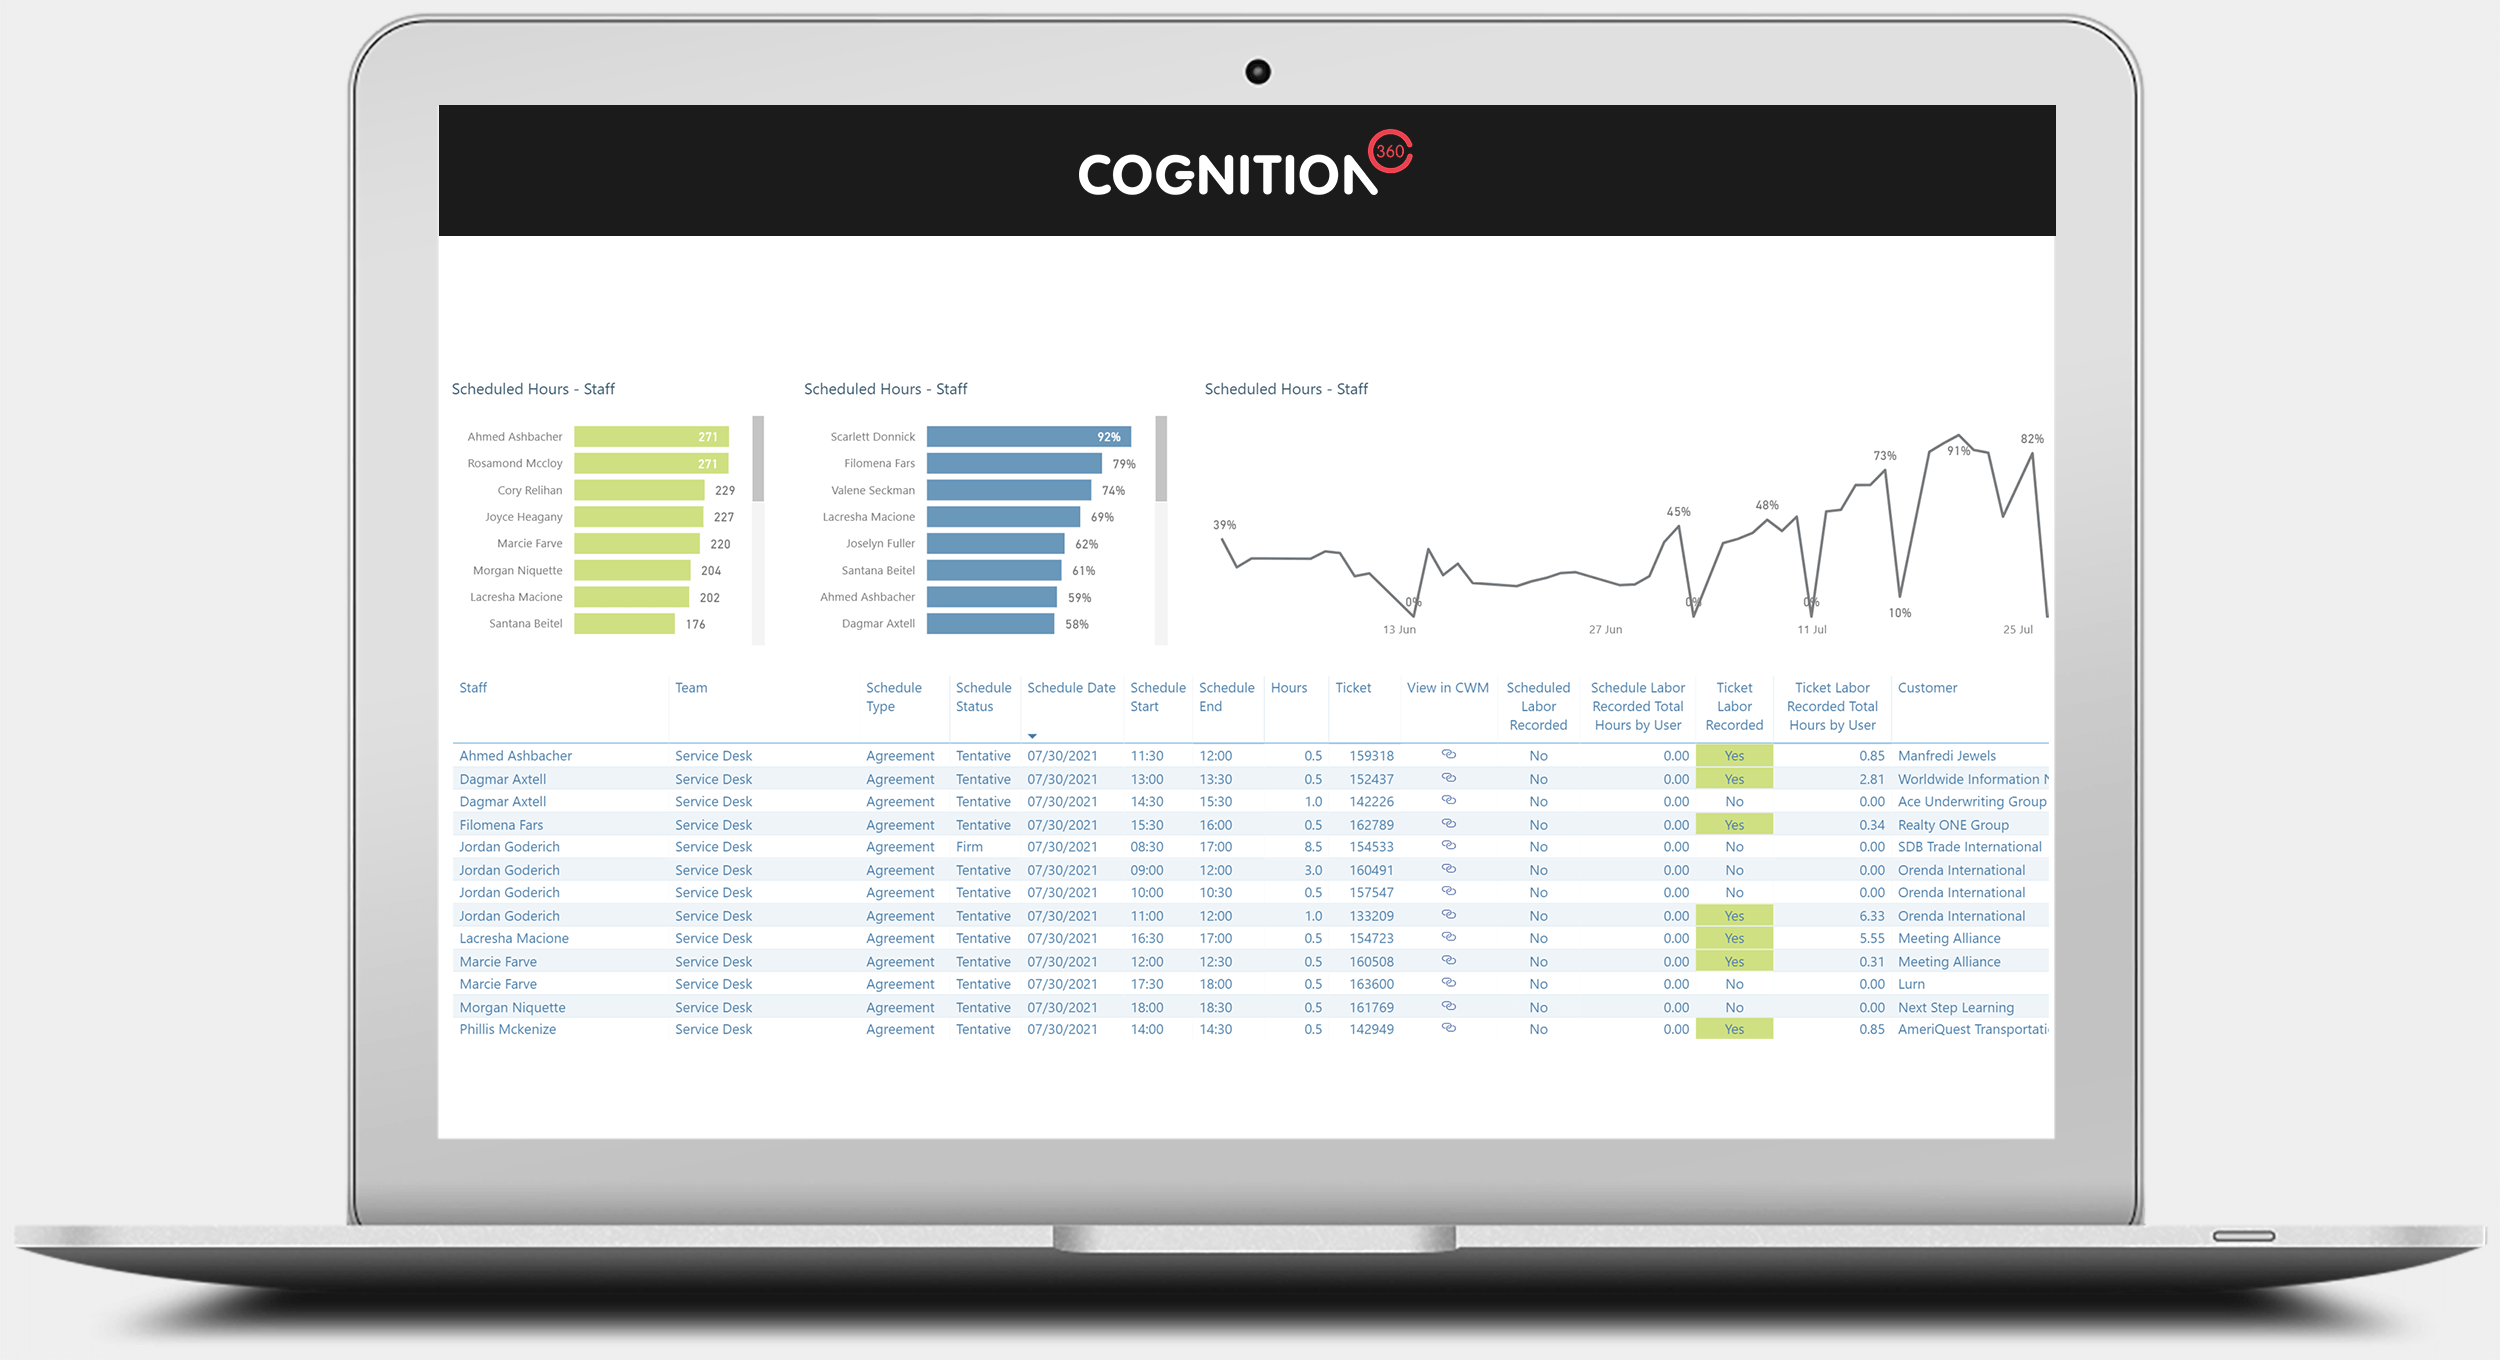
View scheduled resources on tickets. See if labor was recorded during the schedule time or at other times. Compare fulfillment rates across team members.
(Number of report views shown: 1)
Image too small? See full size image here
Charge Code Usage
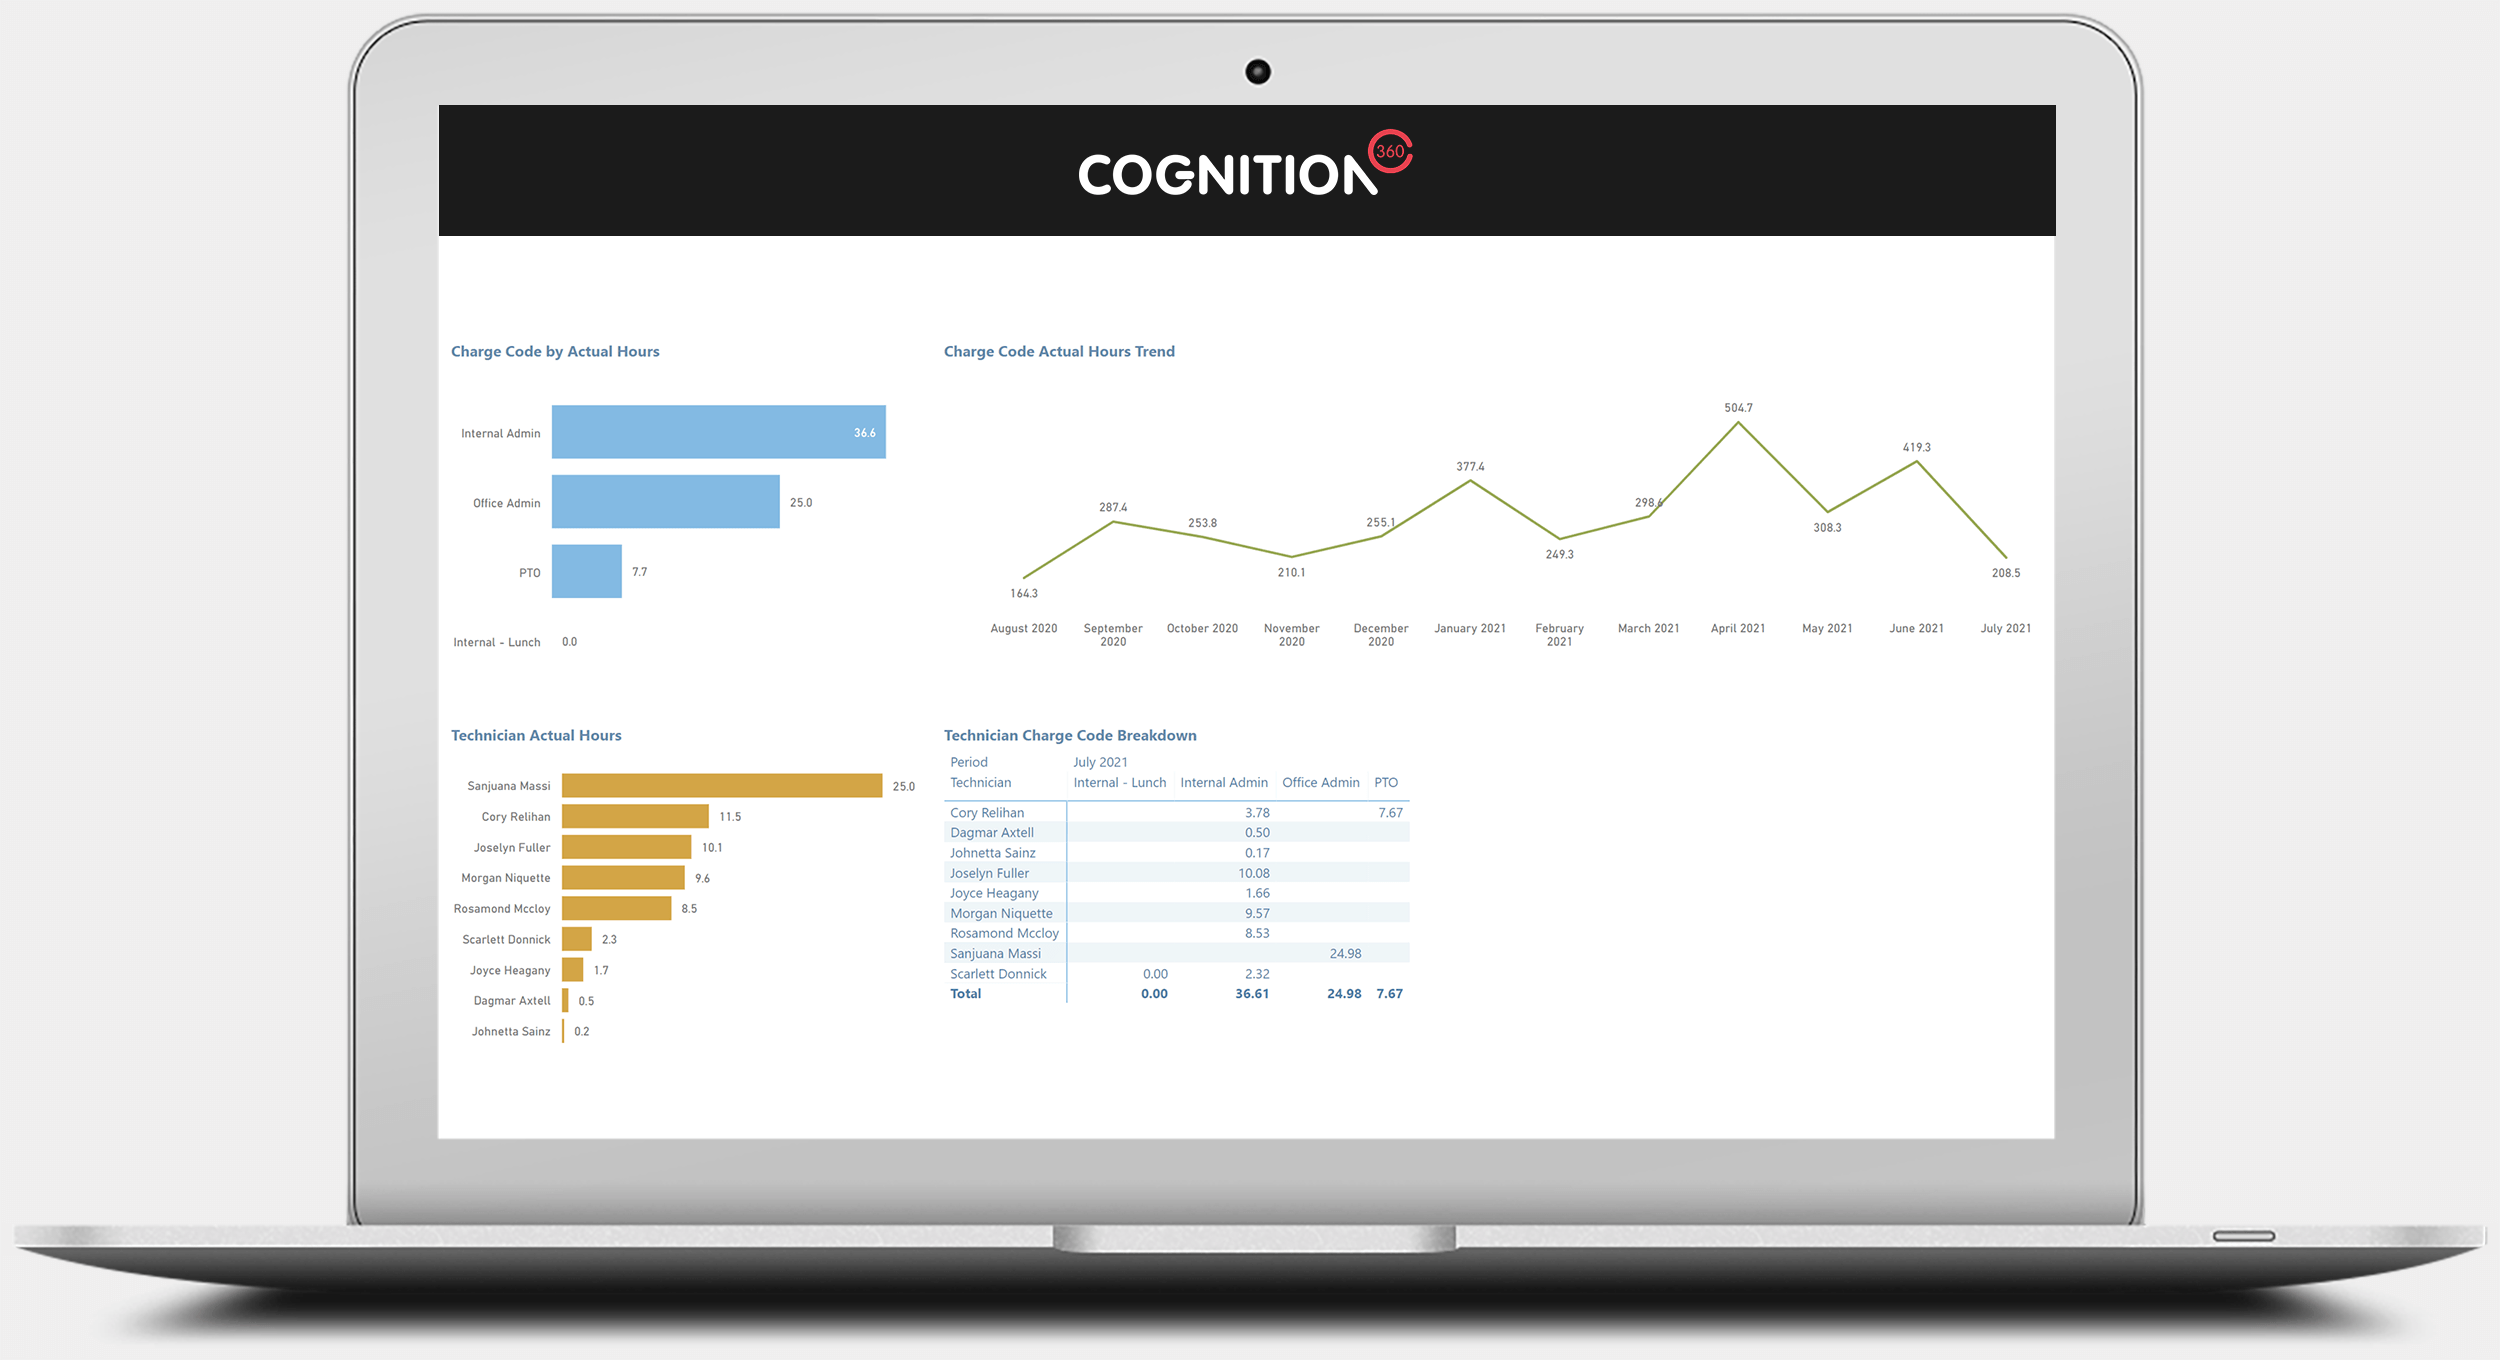
Review use of charge codes in your organization. See which charge codes are used and the hours recorded against them.
(Number of report views shown: 1)
Image too small? See full size image here
Technicians Working on which Customer
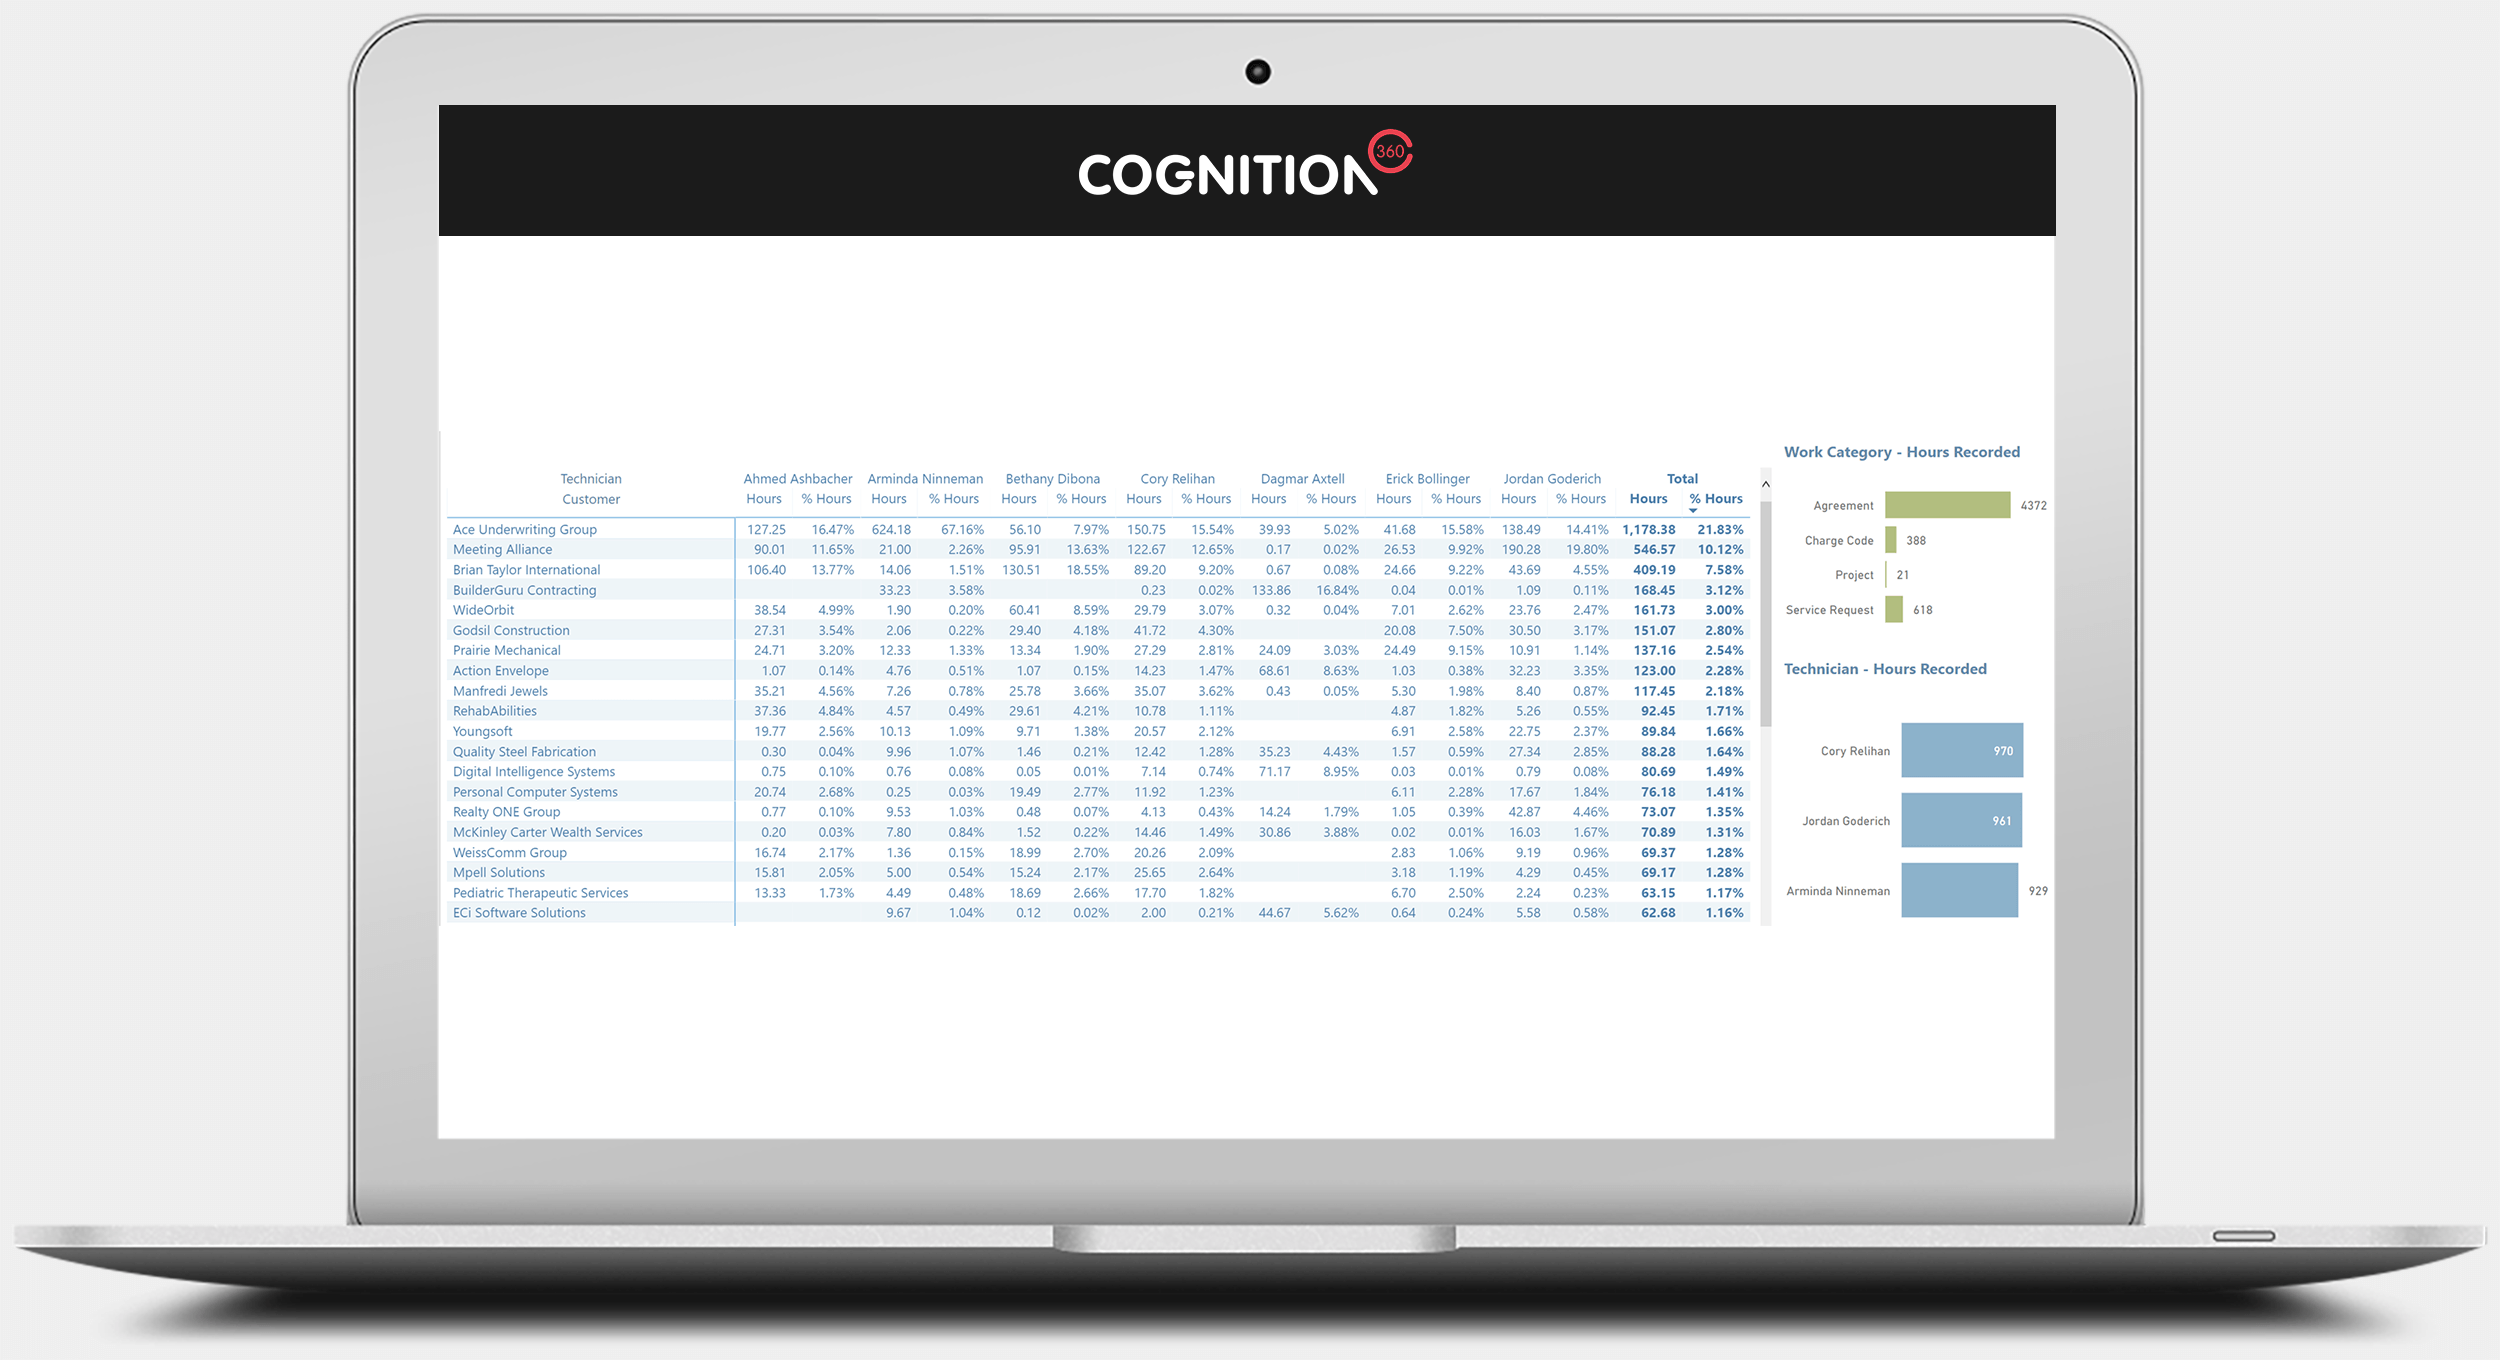
Review labor recorded by each technician and for each customer. See the split of Agreement and Non-Agreement labor for customers. See which technicians are recording labor for which customer.
(Number of report views shown: 1)
Image too small? See full size image here
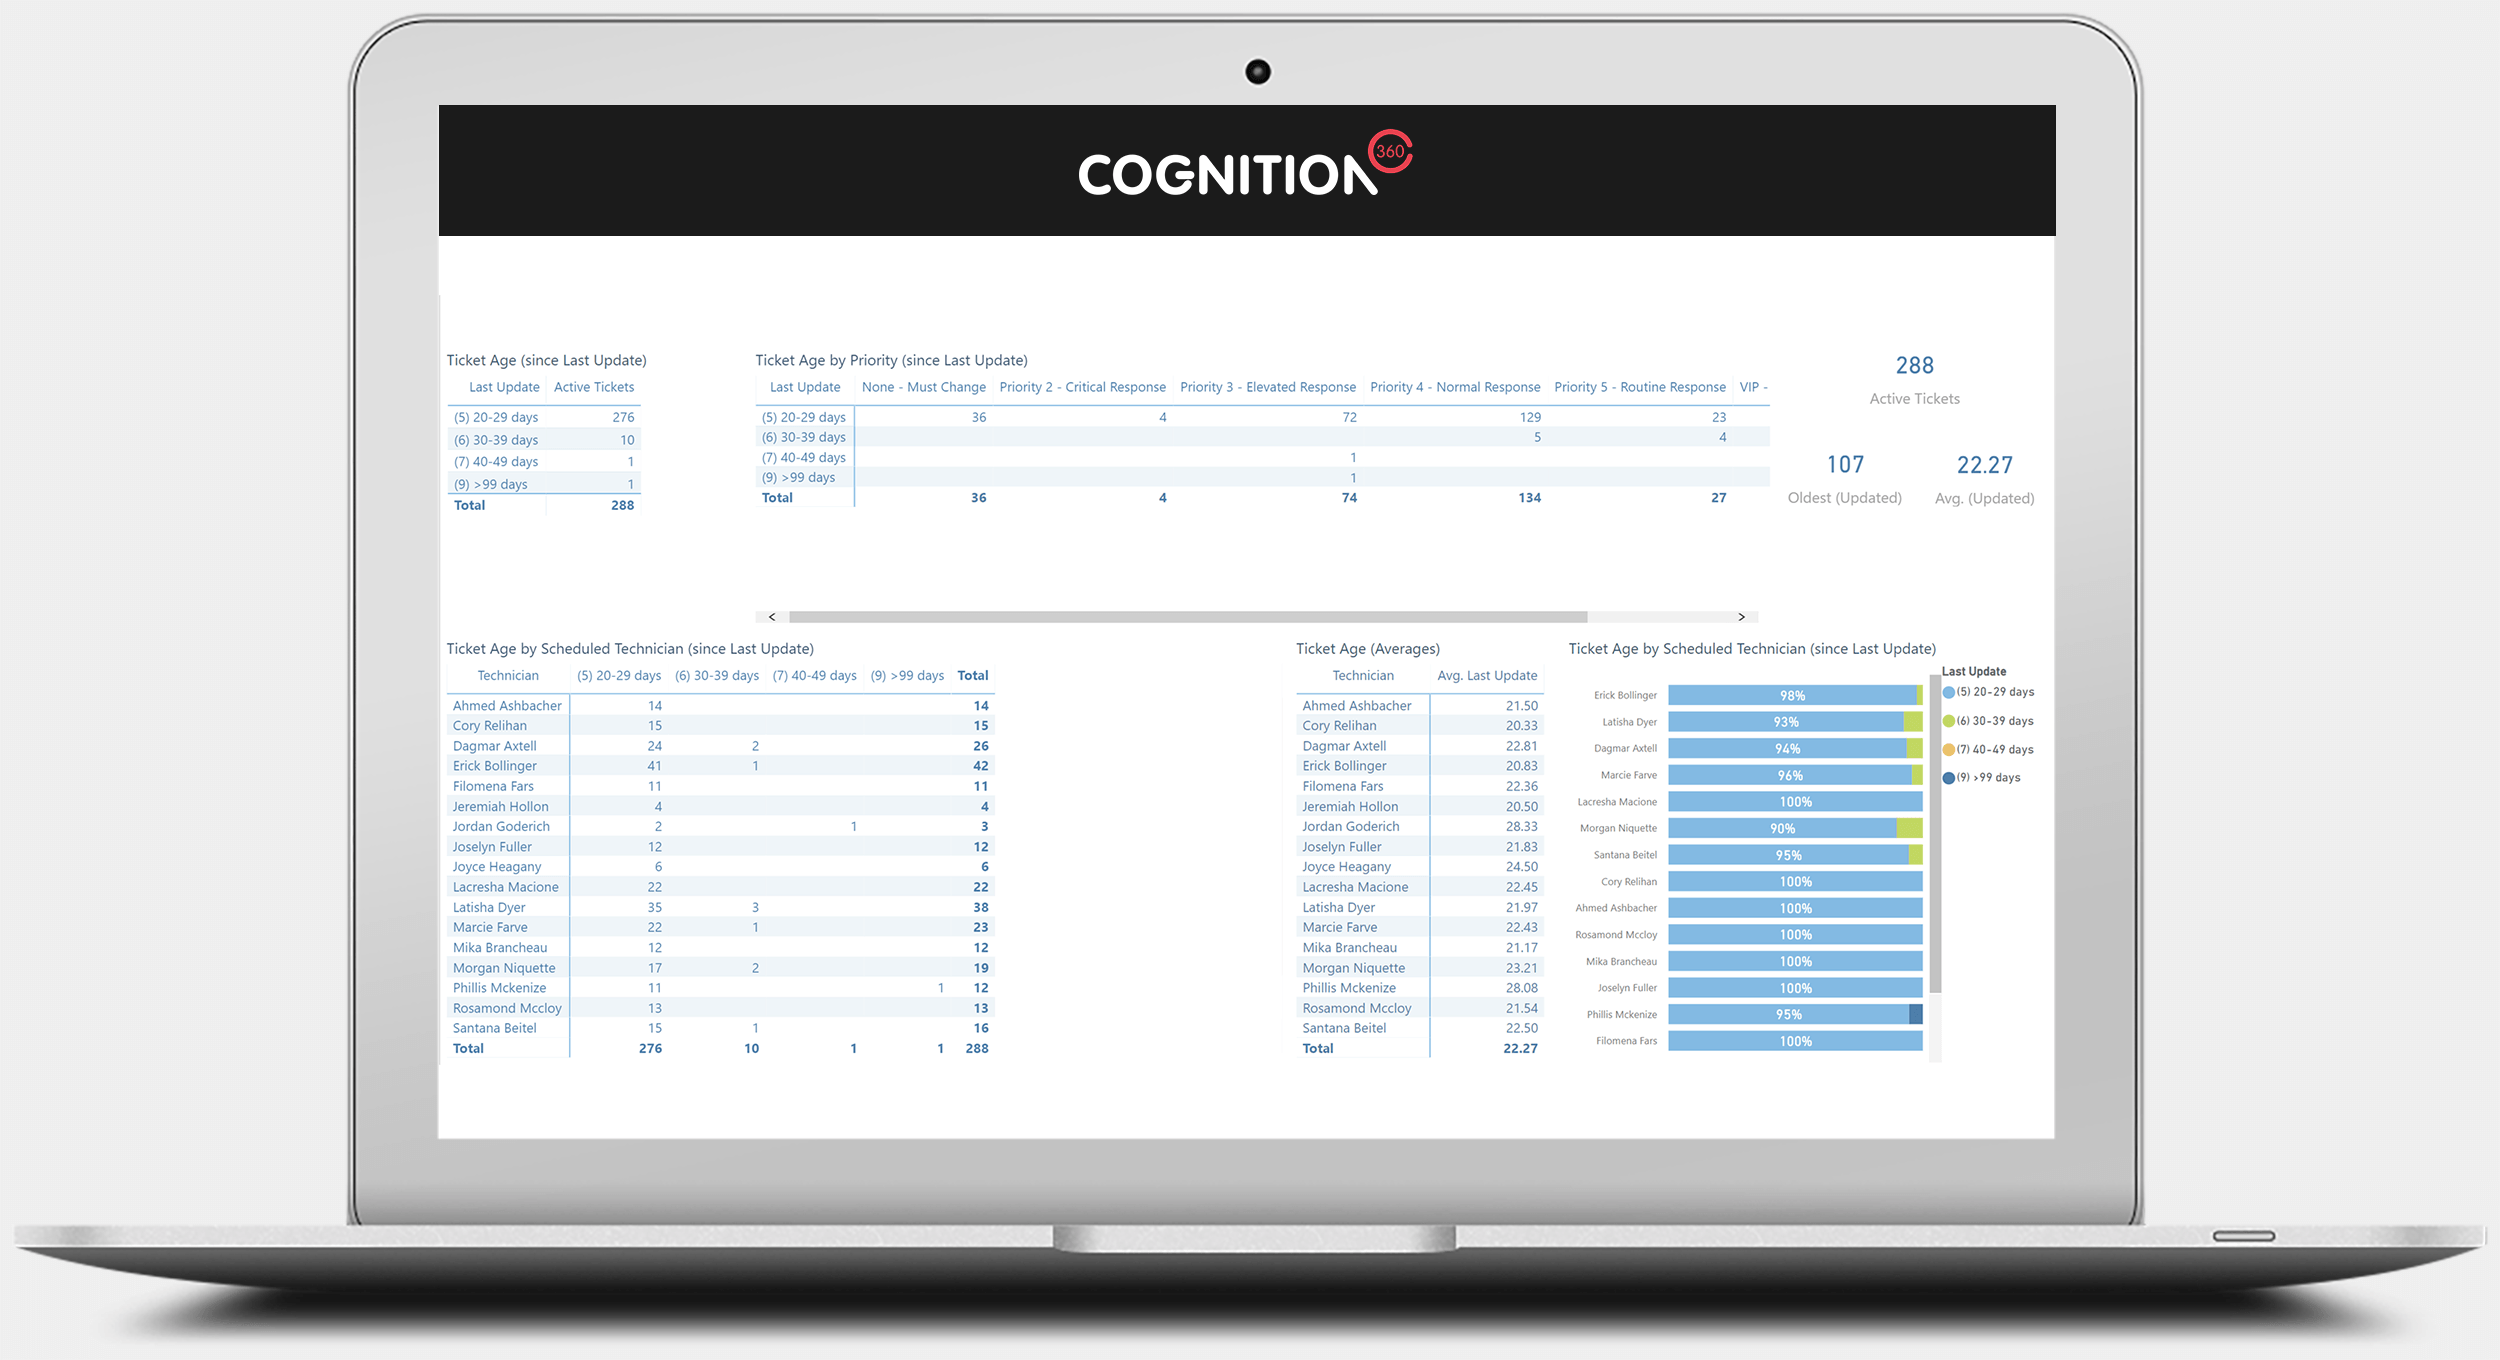
Active Tickets by Technician
For the Active Ticket population, see how frequently the assigned resources are updating tickets. Quickly see tickets that have not been updated for X days. Compare technicians for the number of assigned tickets and the average days since ticket last updated.
(Number of report views shown: 1)
Image too small? See full size image here
MAY 2021
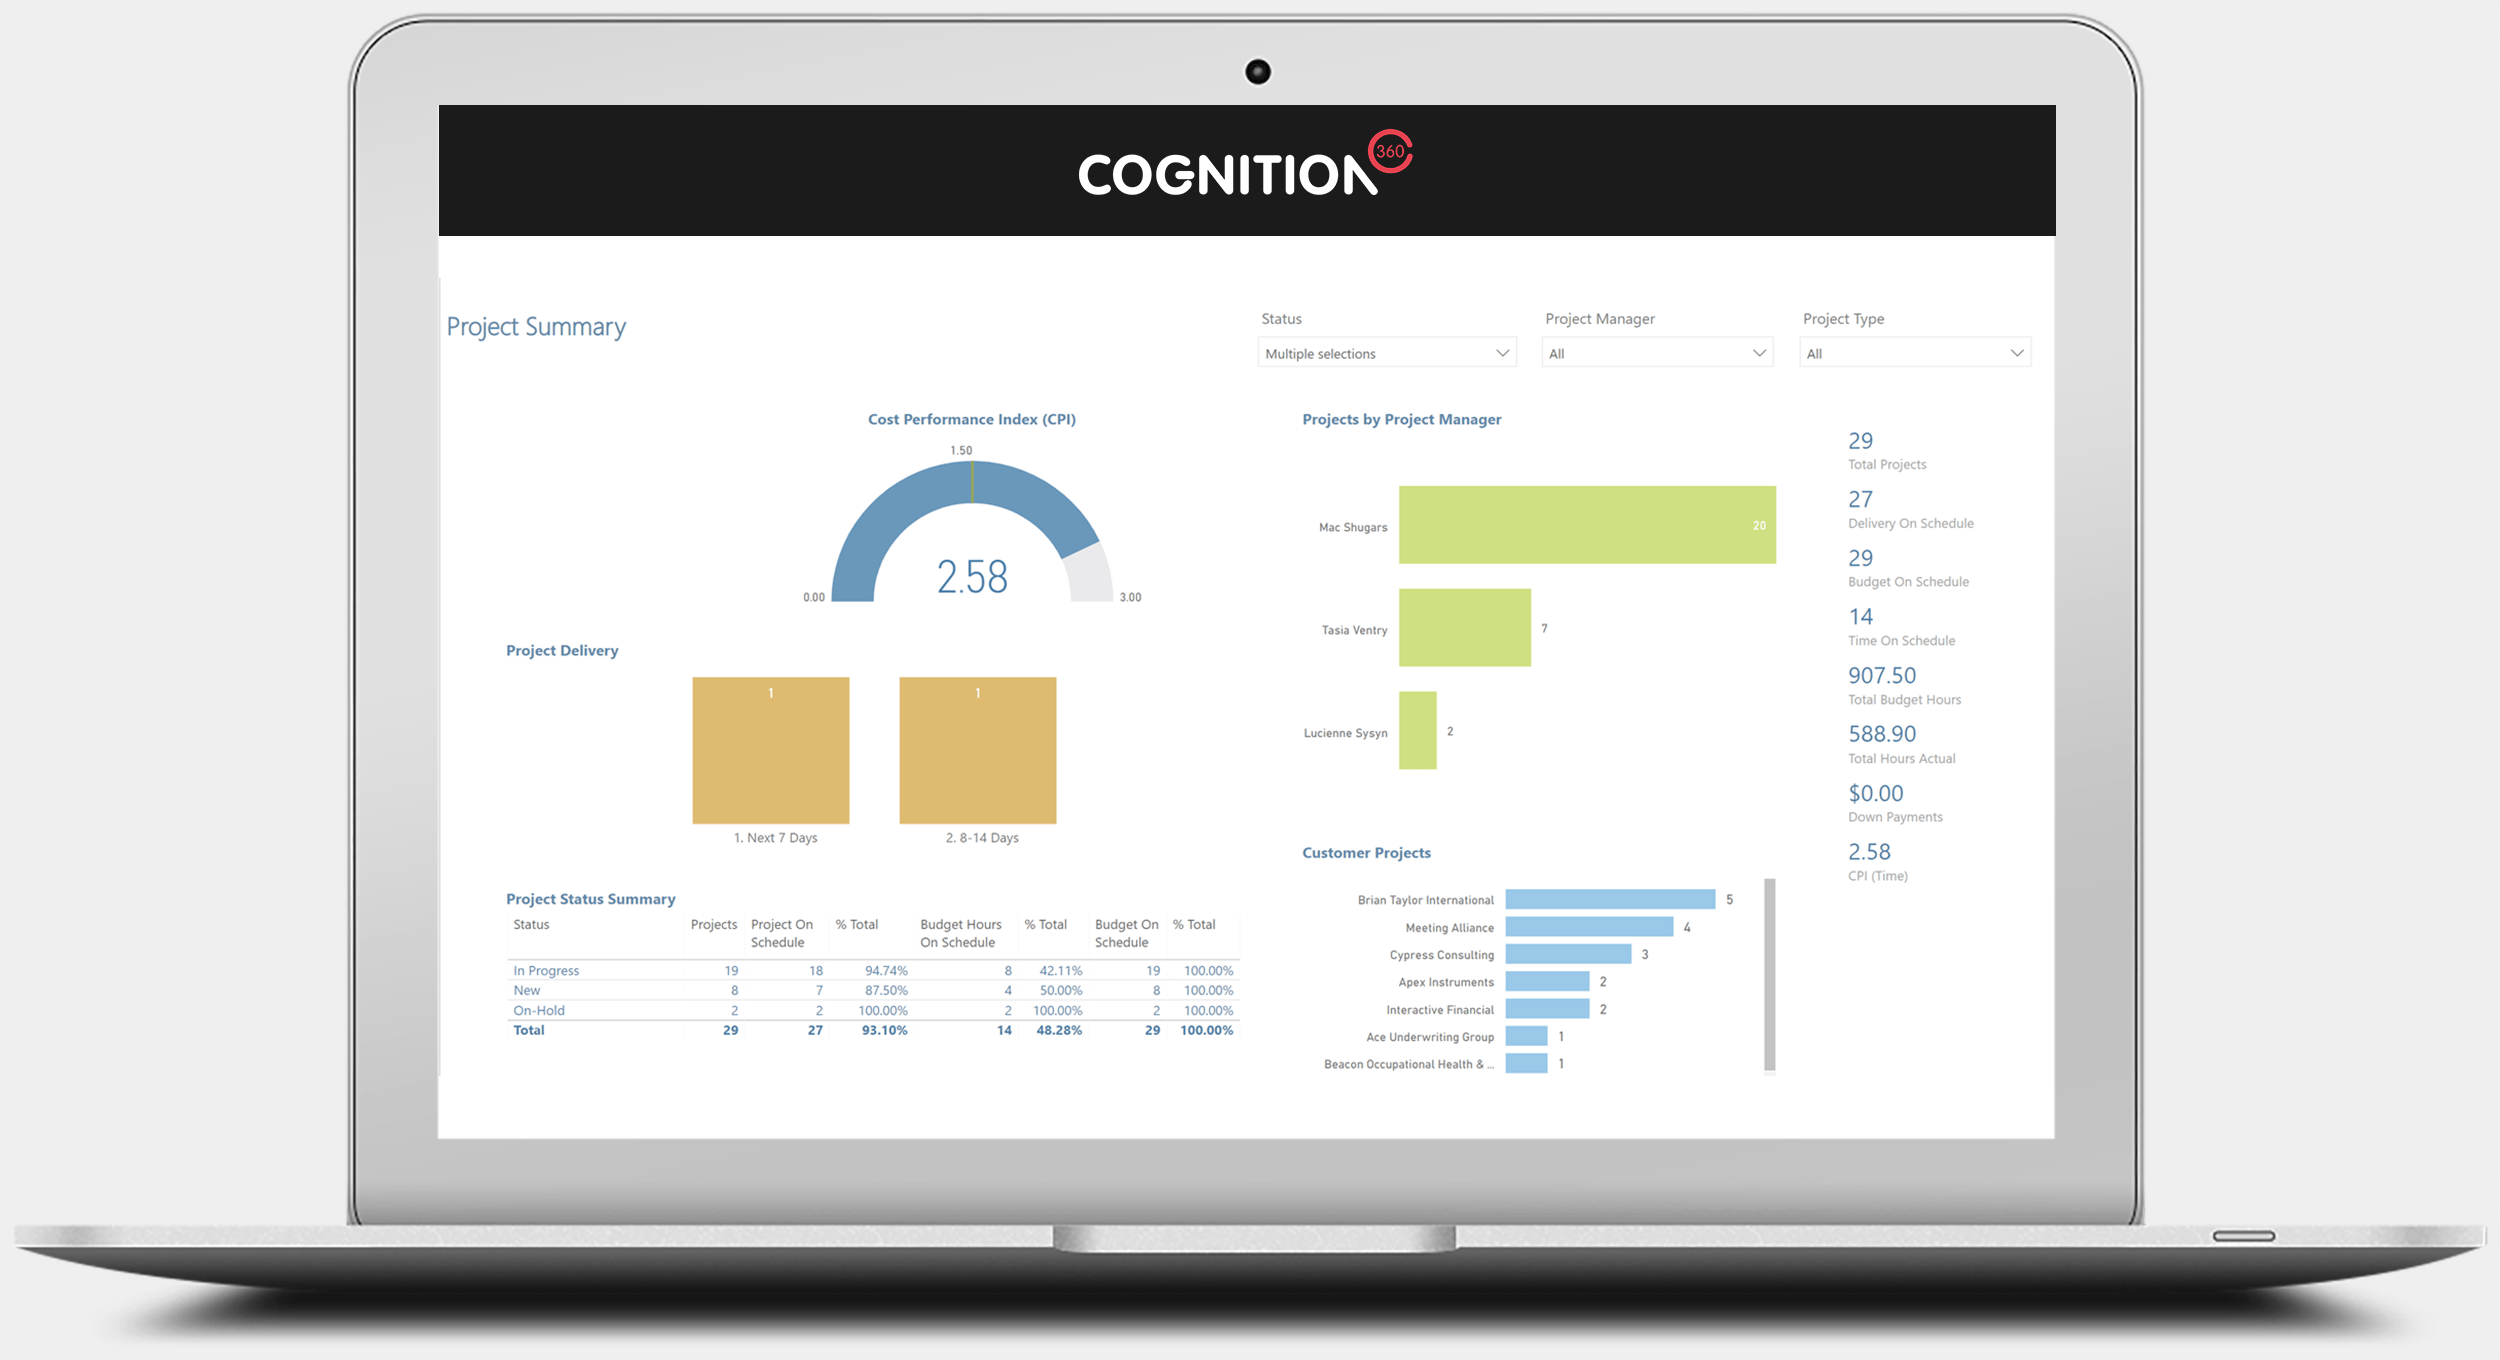
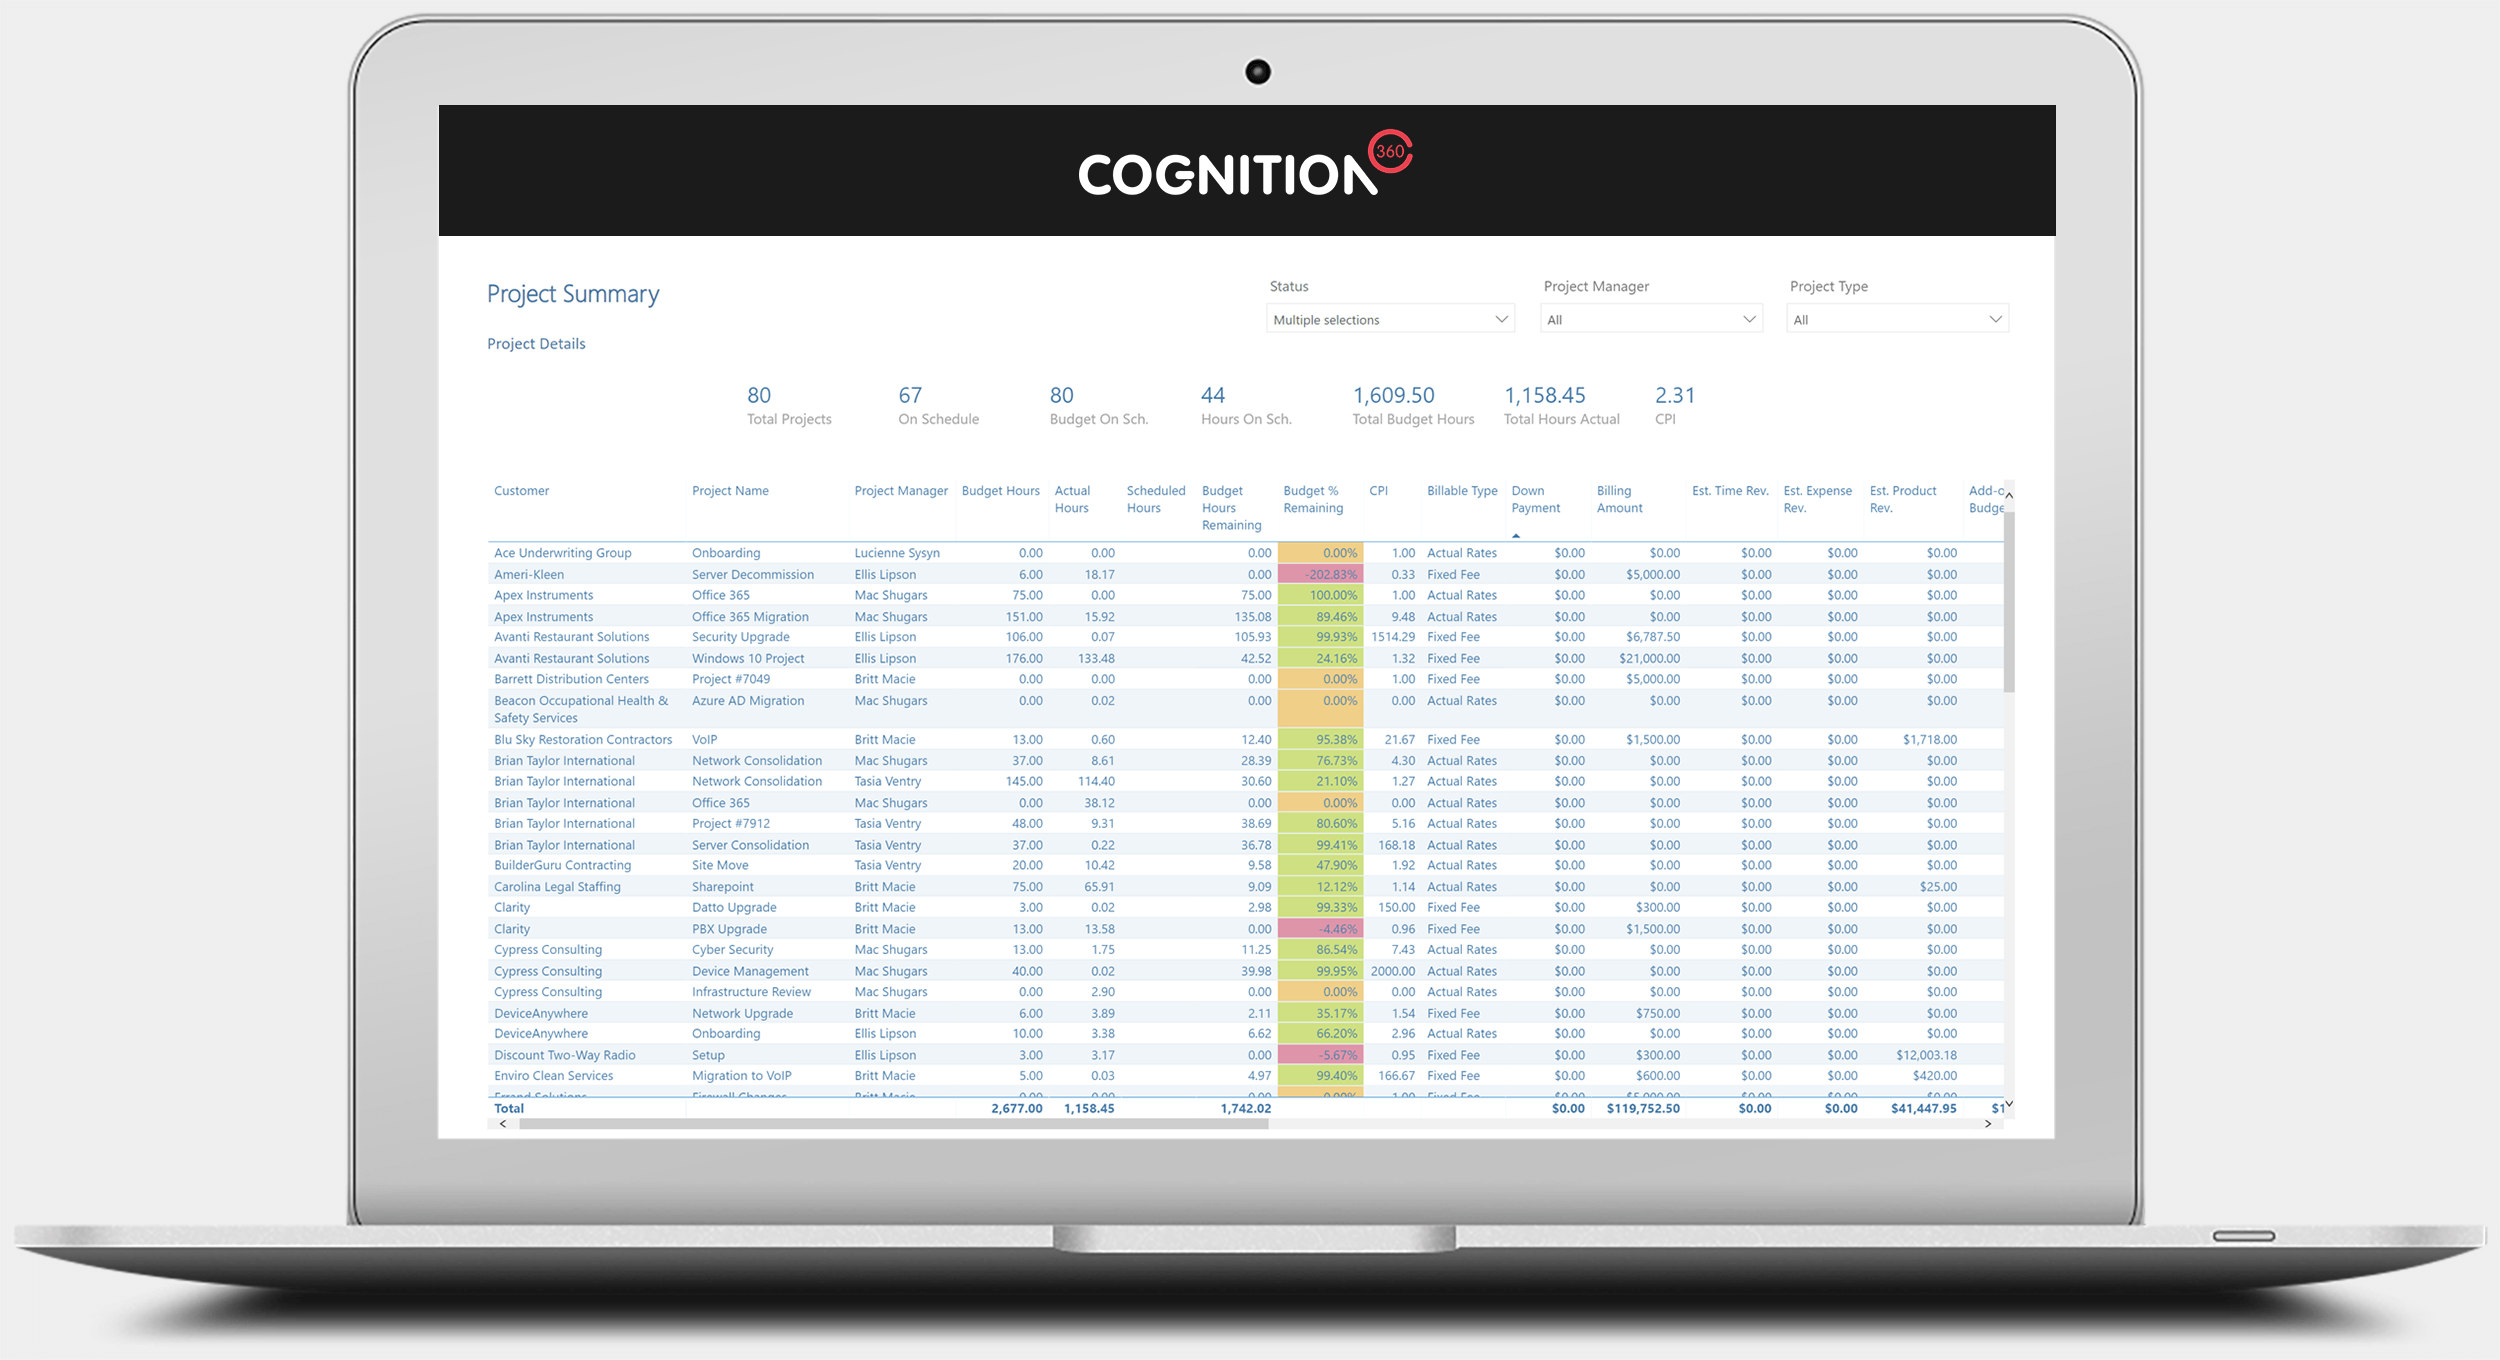
Project Summary Report
An overview of all projects across the organization
The Project Summary report allows you to view active or closed projects across your organization, by project manager or by customer. See which projects are running on budget and those which are not. Drill through to project phase, ticket and labor data. The report also shows information on active project scheduled resources and resource schedules across all projects.
(Number of report views shown: 2)
Images too small? See full size images: View A (Project Summary); View B (Project Summary – Project Details)
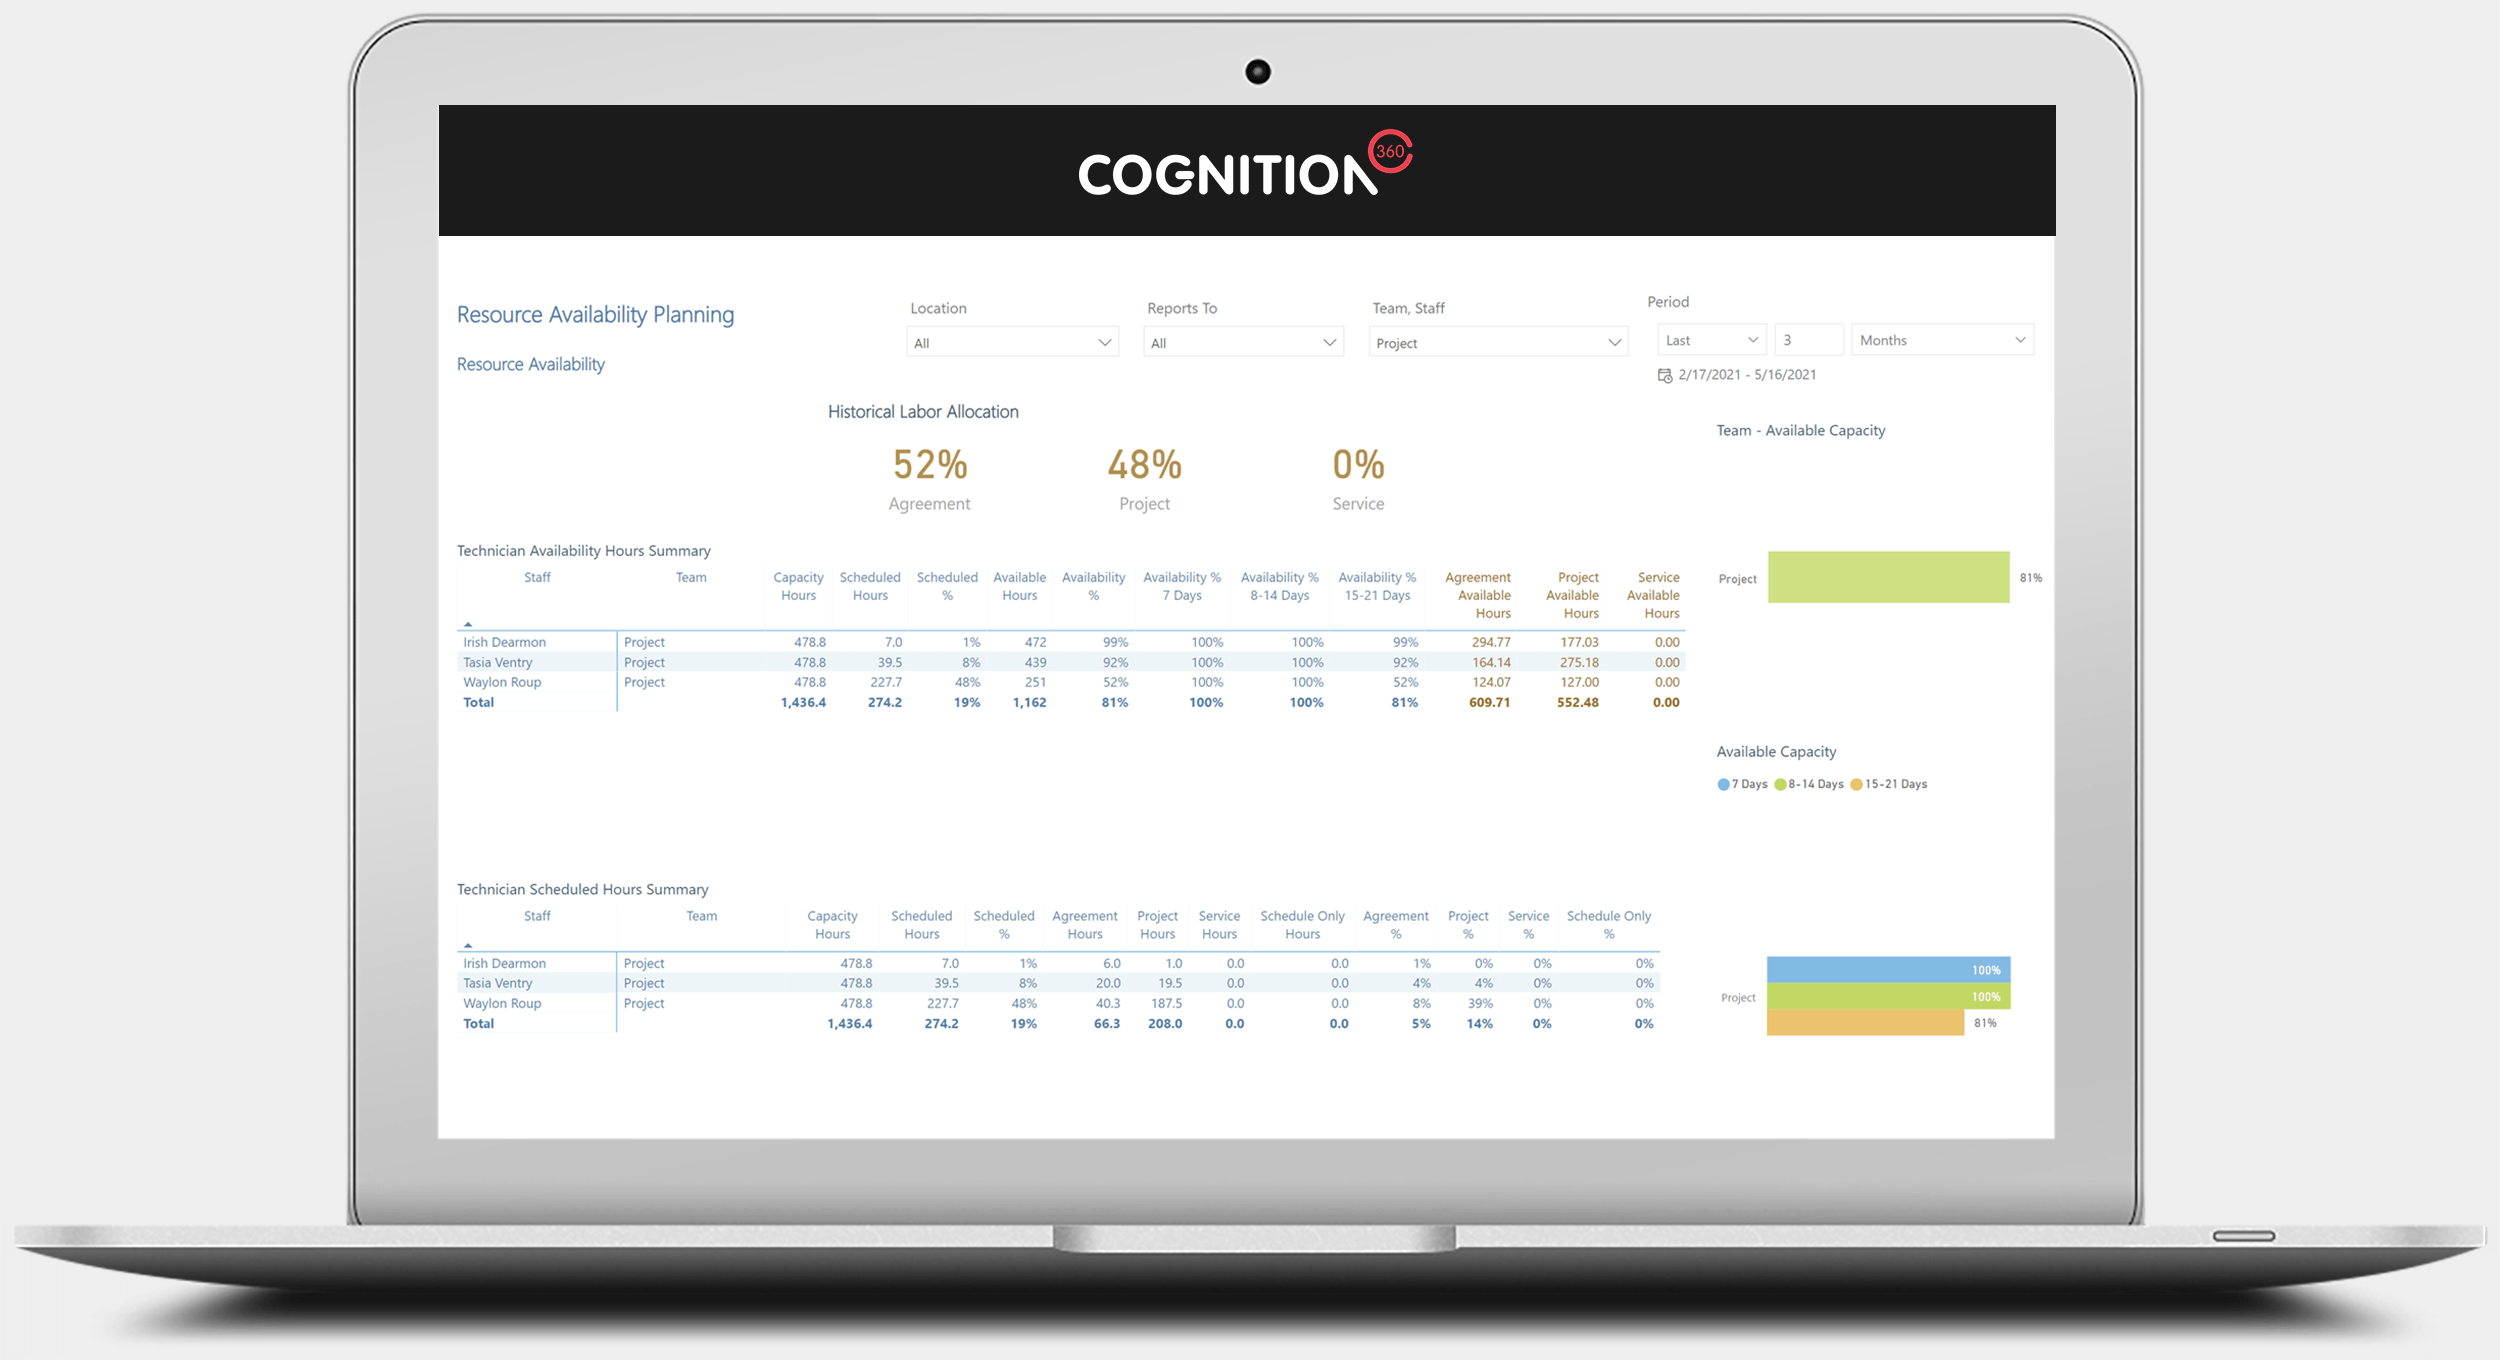
Resource Availability Report
See available capacity of teams/resources
The Resource Availability report uses ConnectWise Manage schedule data to show which Team/Resources have capacity available to take on addition work. View data on labor allocation between project and non-project labor. Requires the use of the scheduling to ensure time is scheduled to see available capacity.
(Number of report views shown: 1)
Image too small? See full size image
APRIL 2021
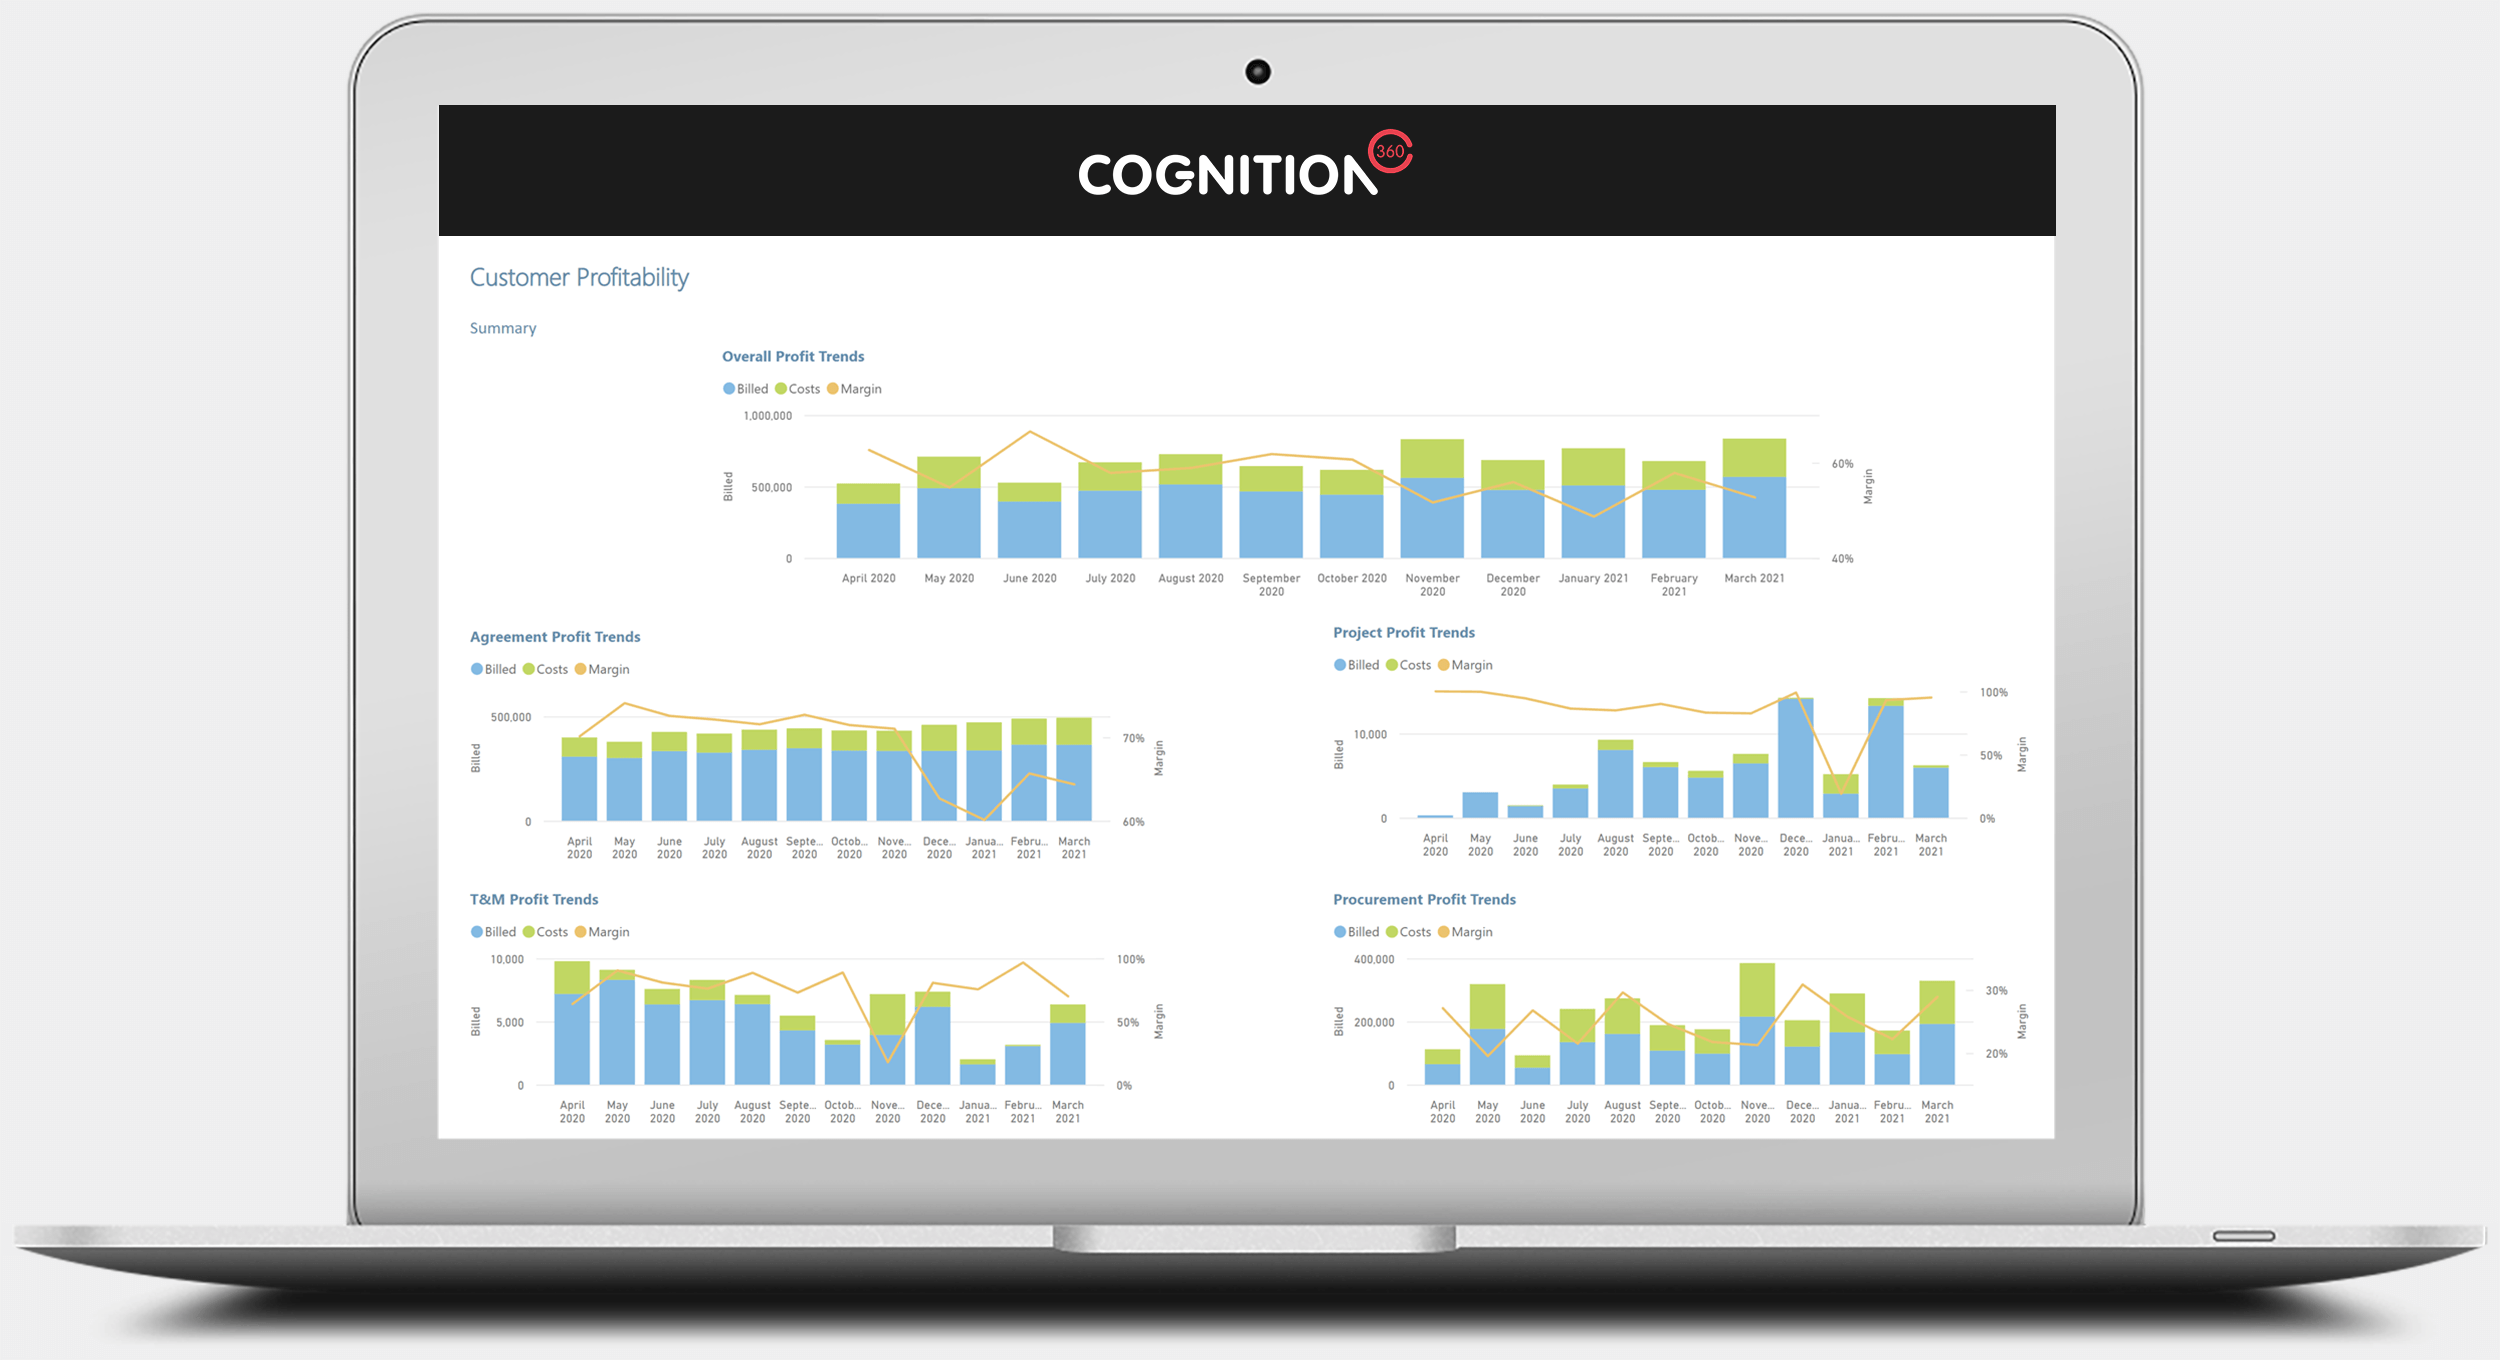
Customer Profitability Report
Understand which customers are more profitable and why
A major redesign of our existing Customer Profitability Report. Using data from invoices generated in ConnectWise Manage, the report shows you overall customer profitability and a breakdown of profitability across Agreement, Projects, Time & Material Tickets and Procurement.
(Number of report views shown: 1)
Image too small? See full size image
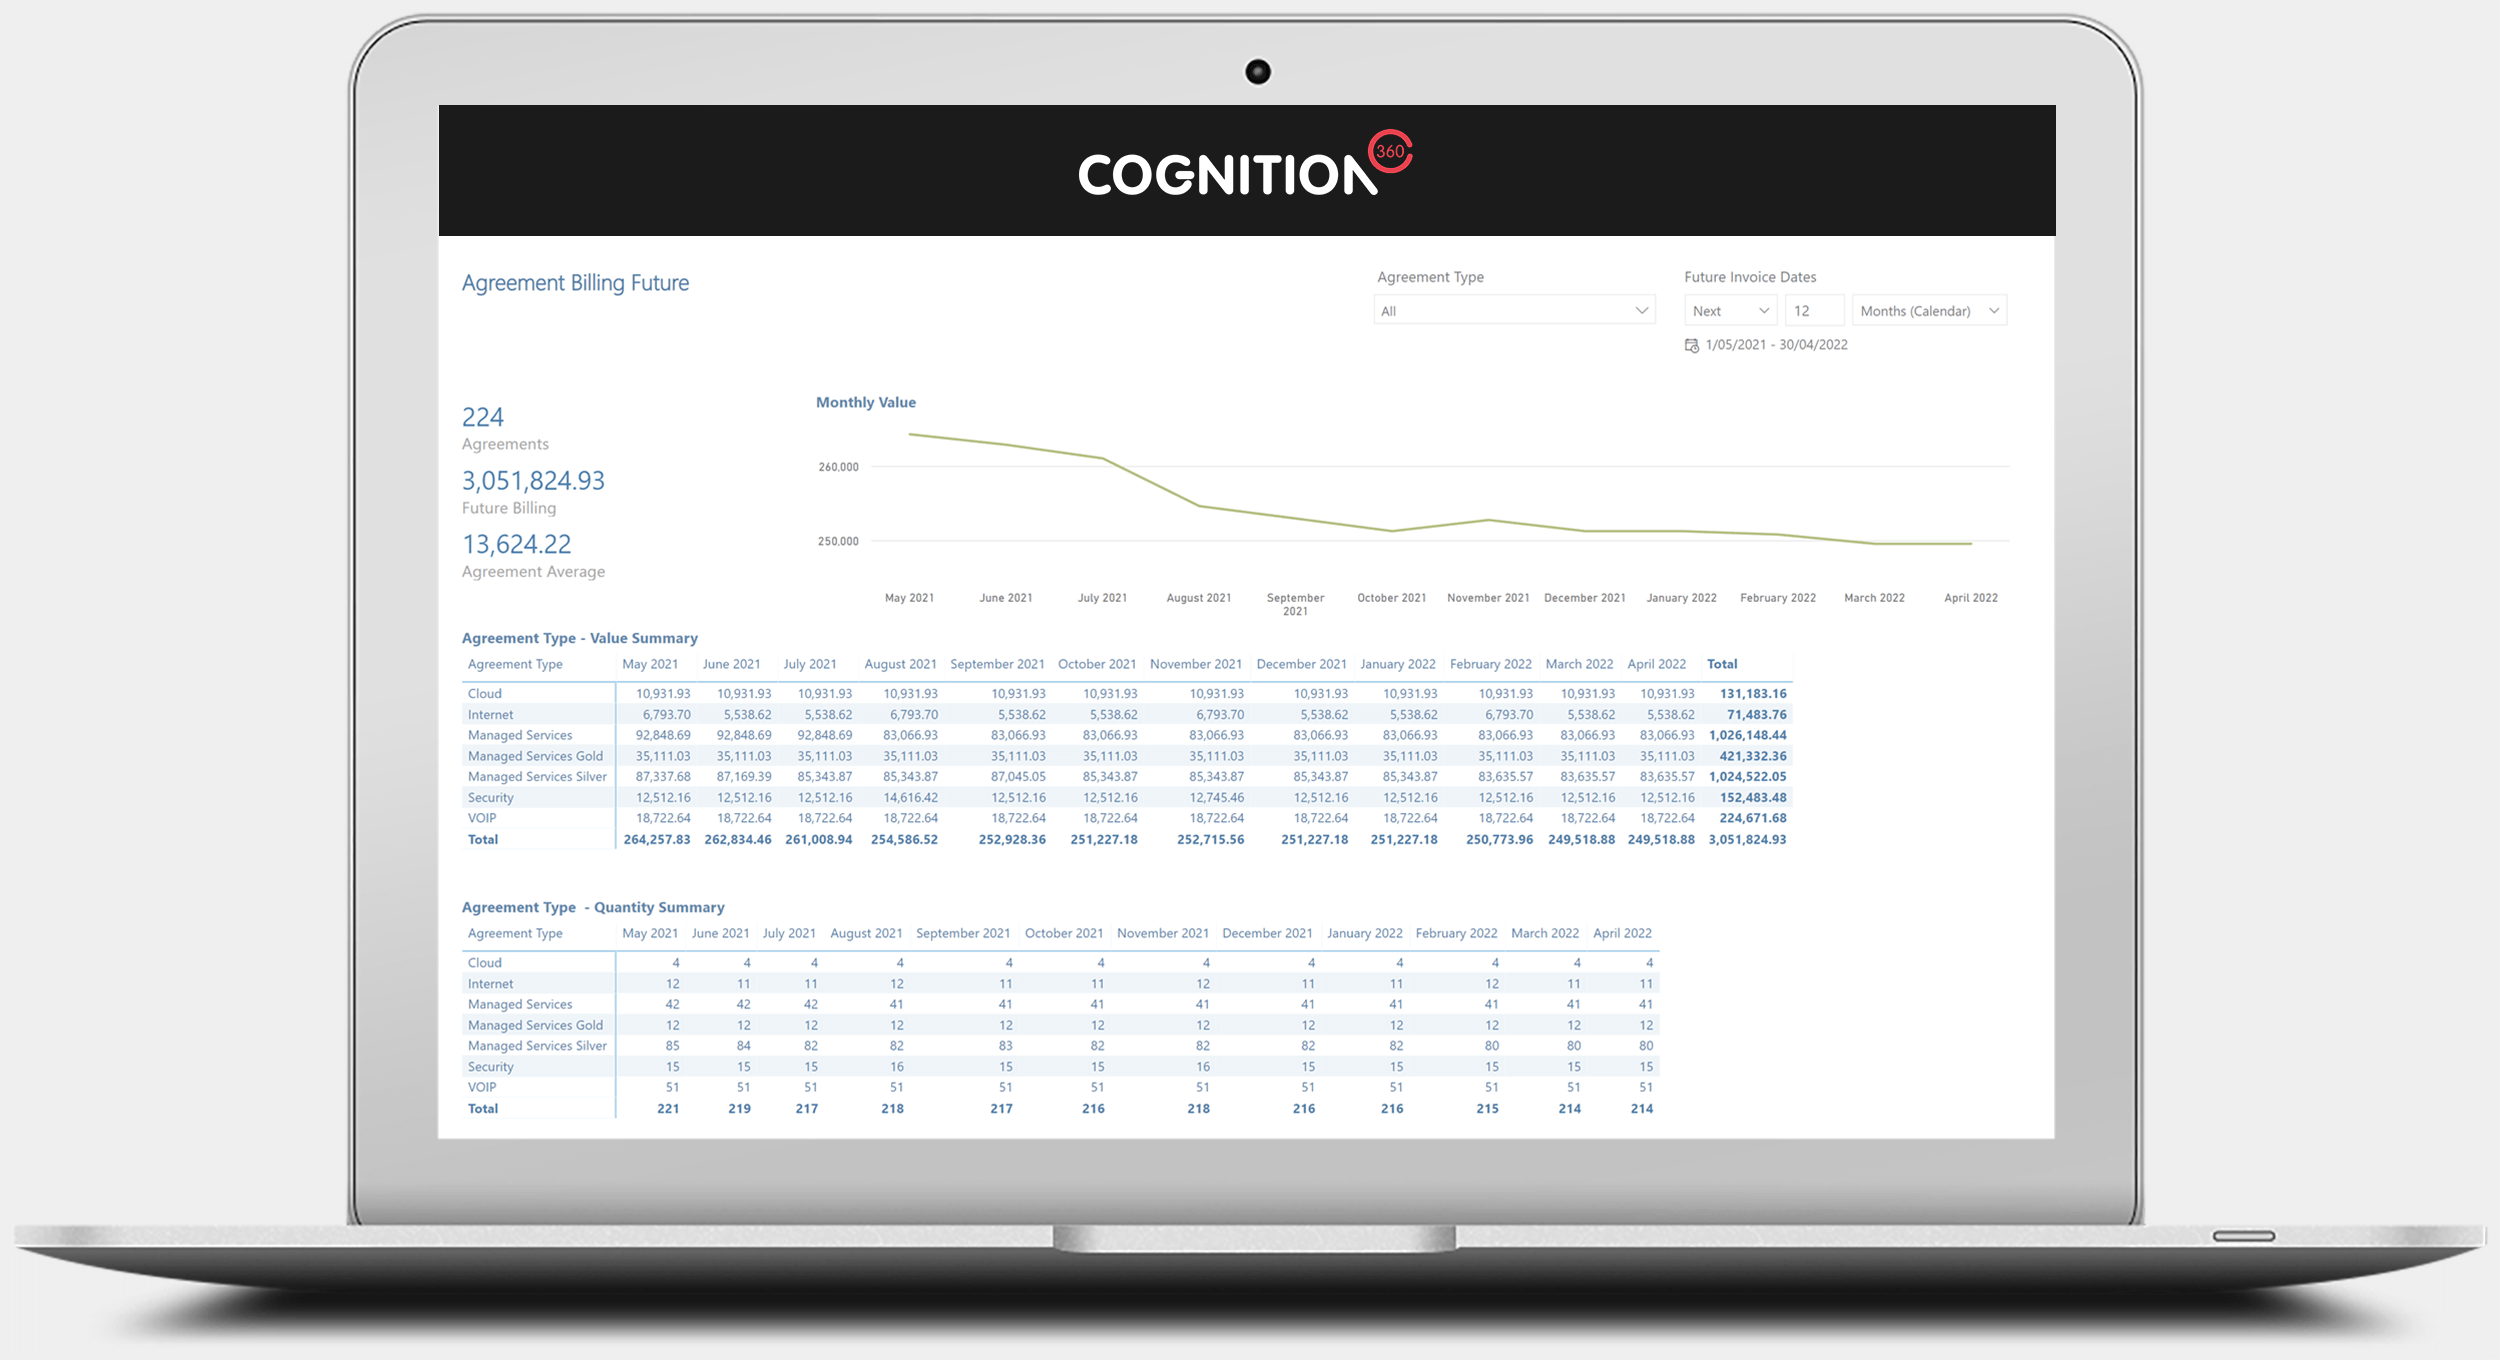
Agreement Future Billing Report
See potential future Recurring Revenue based on your current agreements
The Agreement Future Billing Report takes agreement data and projects the value to be billed each month, based on the values currently stored in ConnectWise Manage. When an agreement is set to expire in the future, it will only be reported up to that date. Likewise, for additions all future expired and new/effective dates are considered in the data reported.
The report allows you to see future billing values based on your current agreement set up. You’ll see the increases and decreases over the coming months and you can drill through to see the agreement data behind the numbers – year, month, last 7 days and yesterday – by Board, Customer and Ticket Type and Subtype.
(Number of report views shown: 1)
Image too small? See full size image
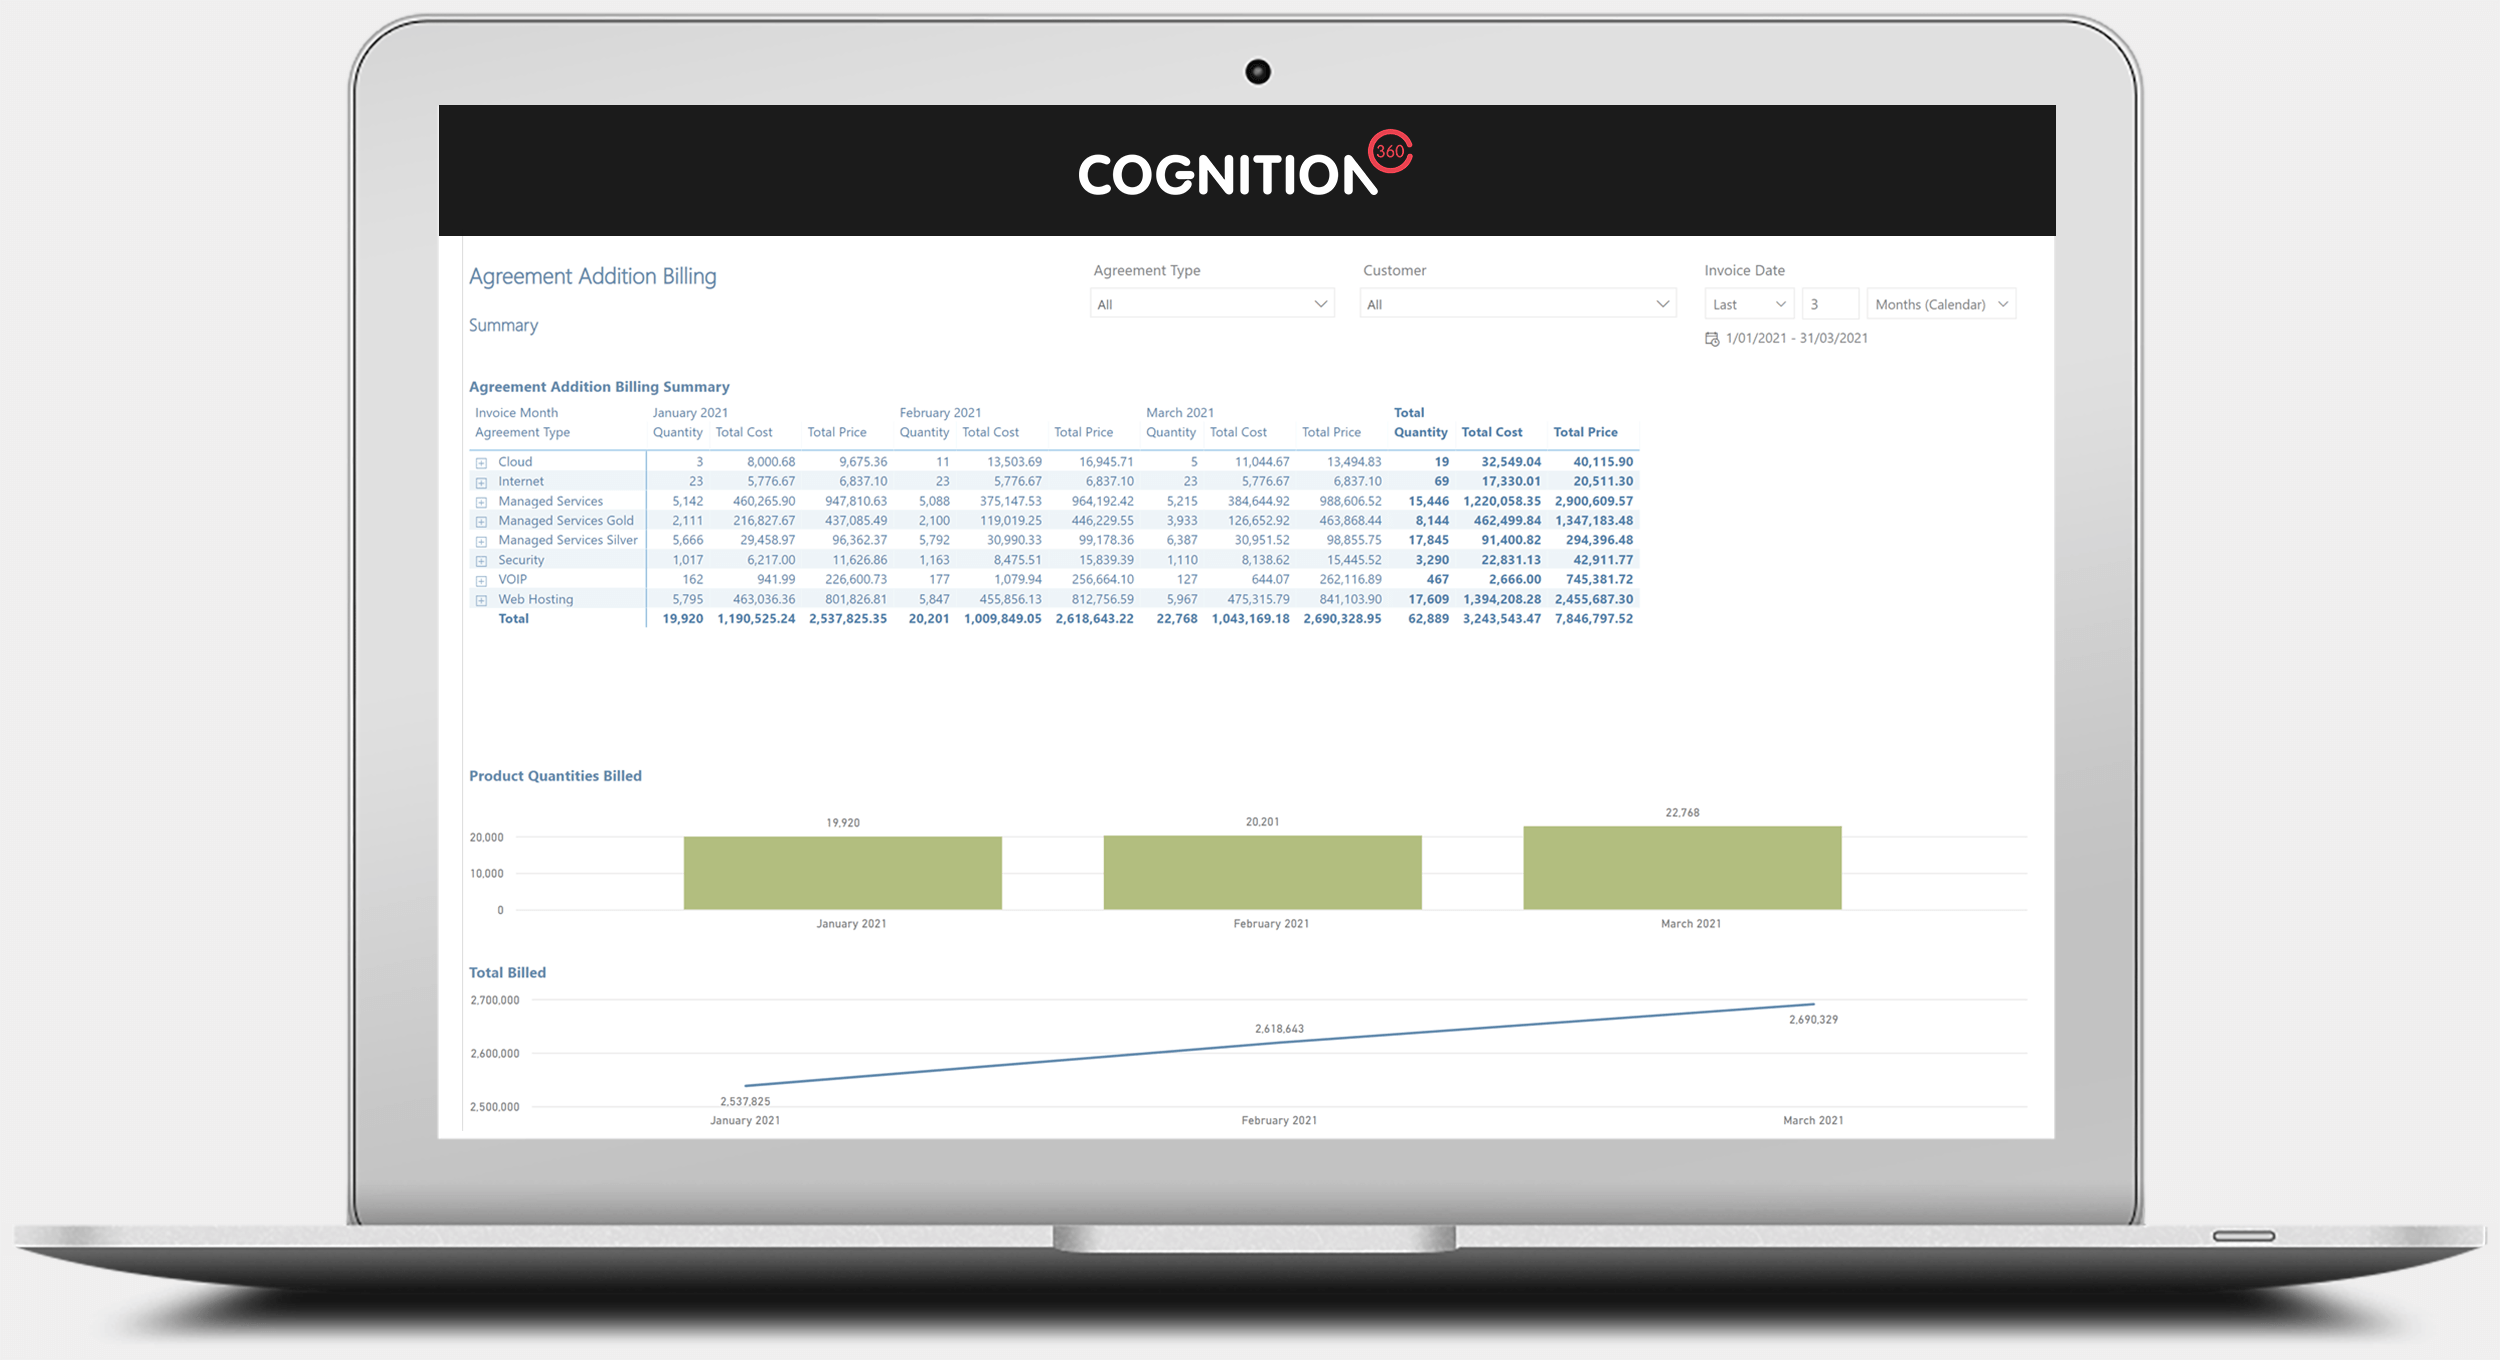
Agreement Addition Billing Report
Review historical addition billing
The Agreement Addition Billing Report shows Additions/Products billed on the Agreement over historical periods. This allows you to view changes in billing at the Addition level.
You can view the data at the Agreement Type level and onwards by Customer and Agreement. Or, you can view from the Addition level by product Class, Type, Category, Subcategory and Product ID.
Drill through is available down to the Product ID and Billing level, which allows you to see the fluctuations in billing for an addition over time.
(Number of report views shown: 1)
Image too small? See full size image
FEBRUARY 2021
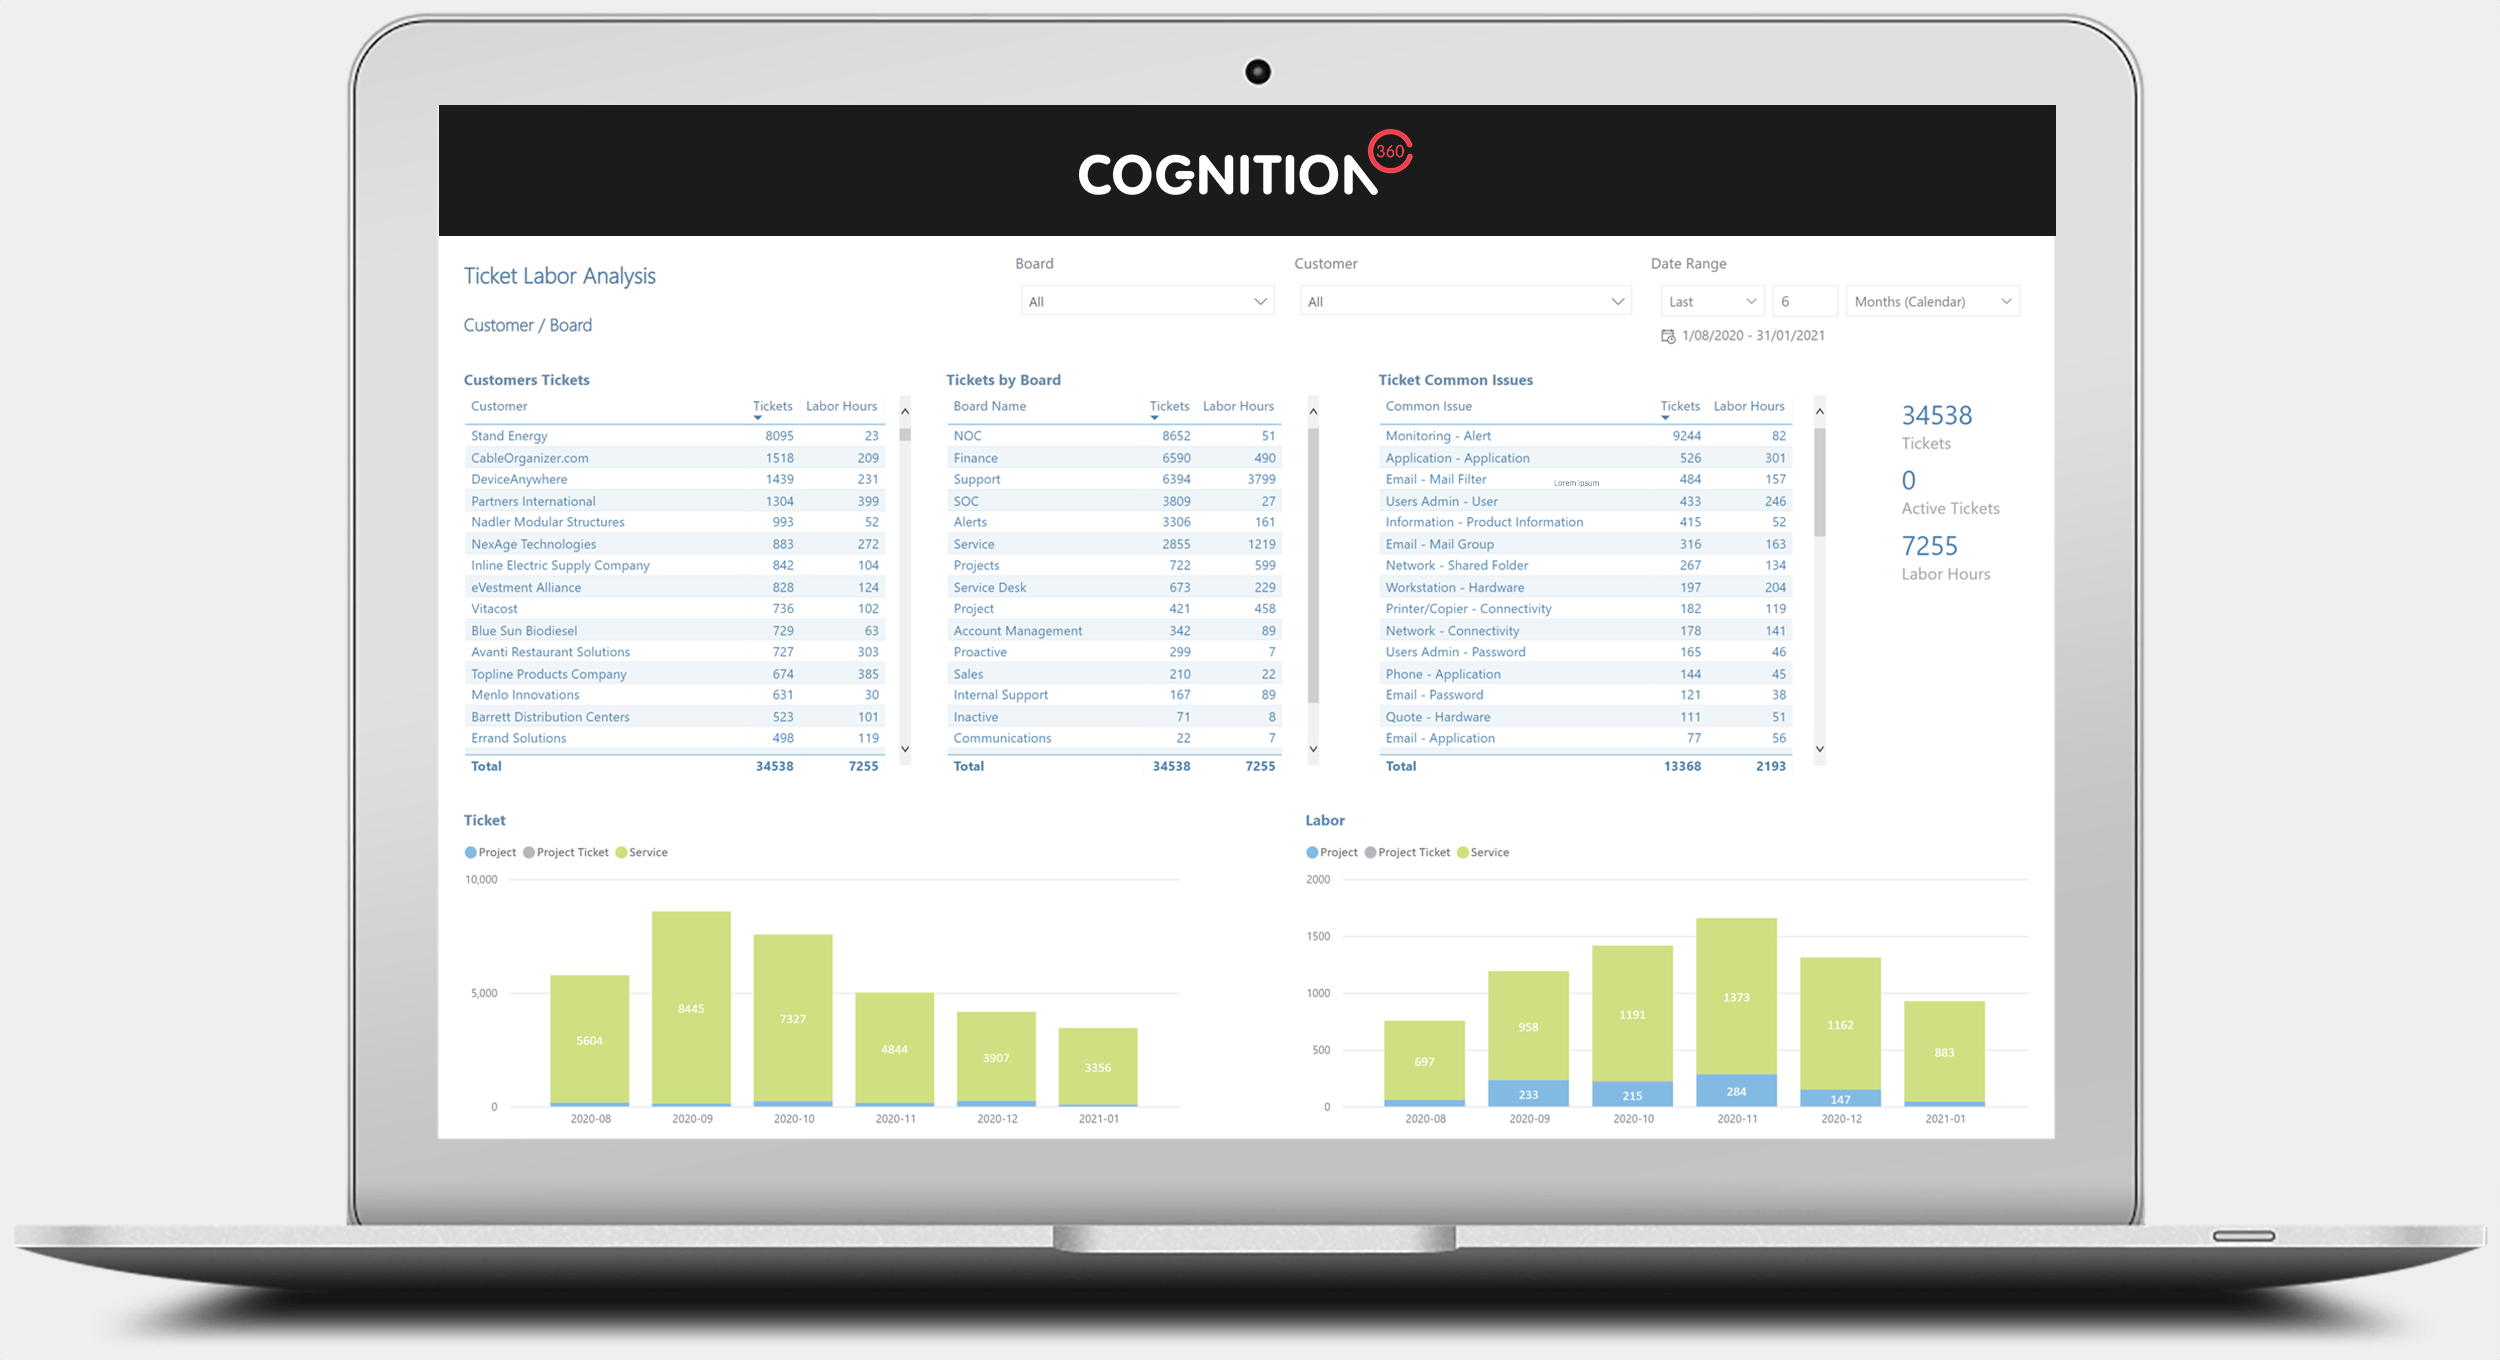
Ticket Labor Analysis Report
Monitor ticket and labor data
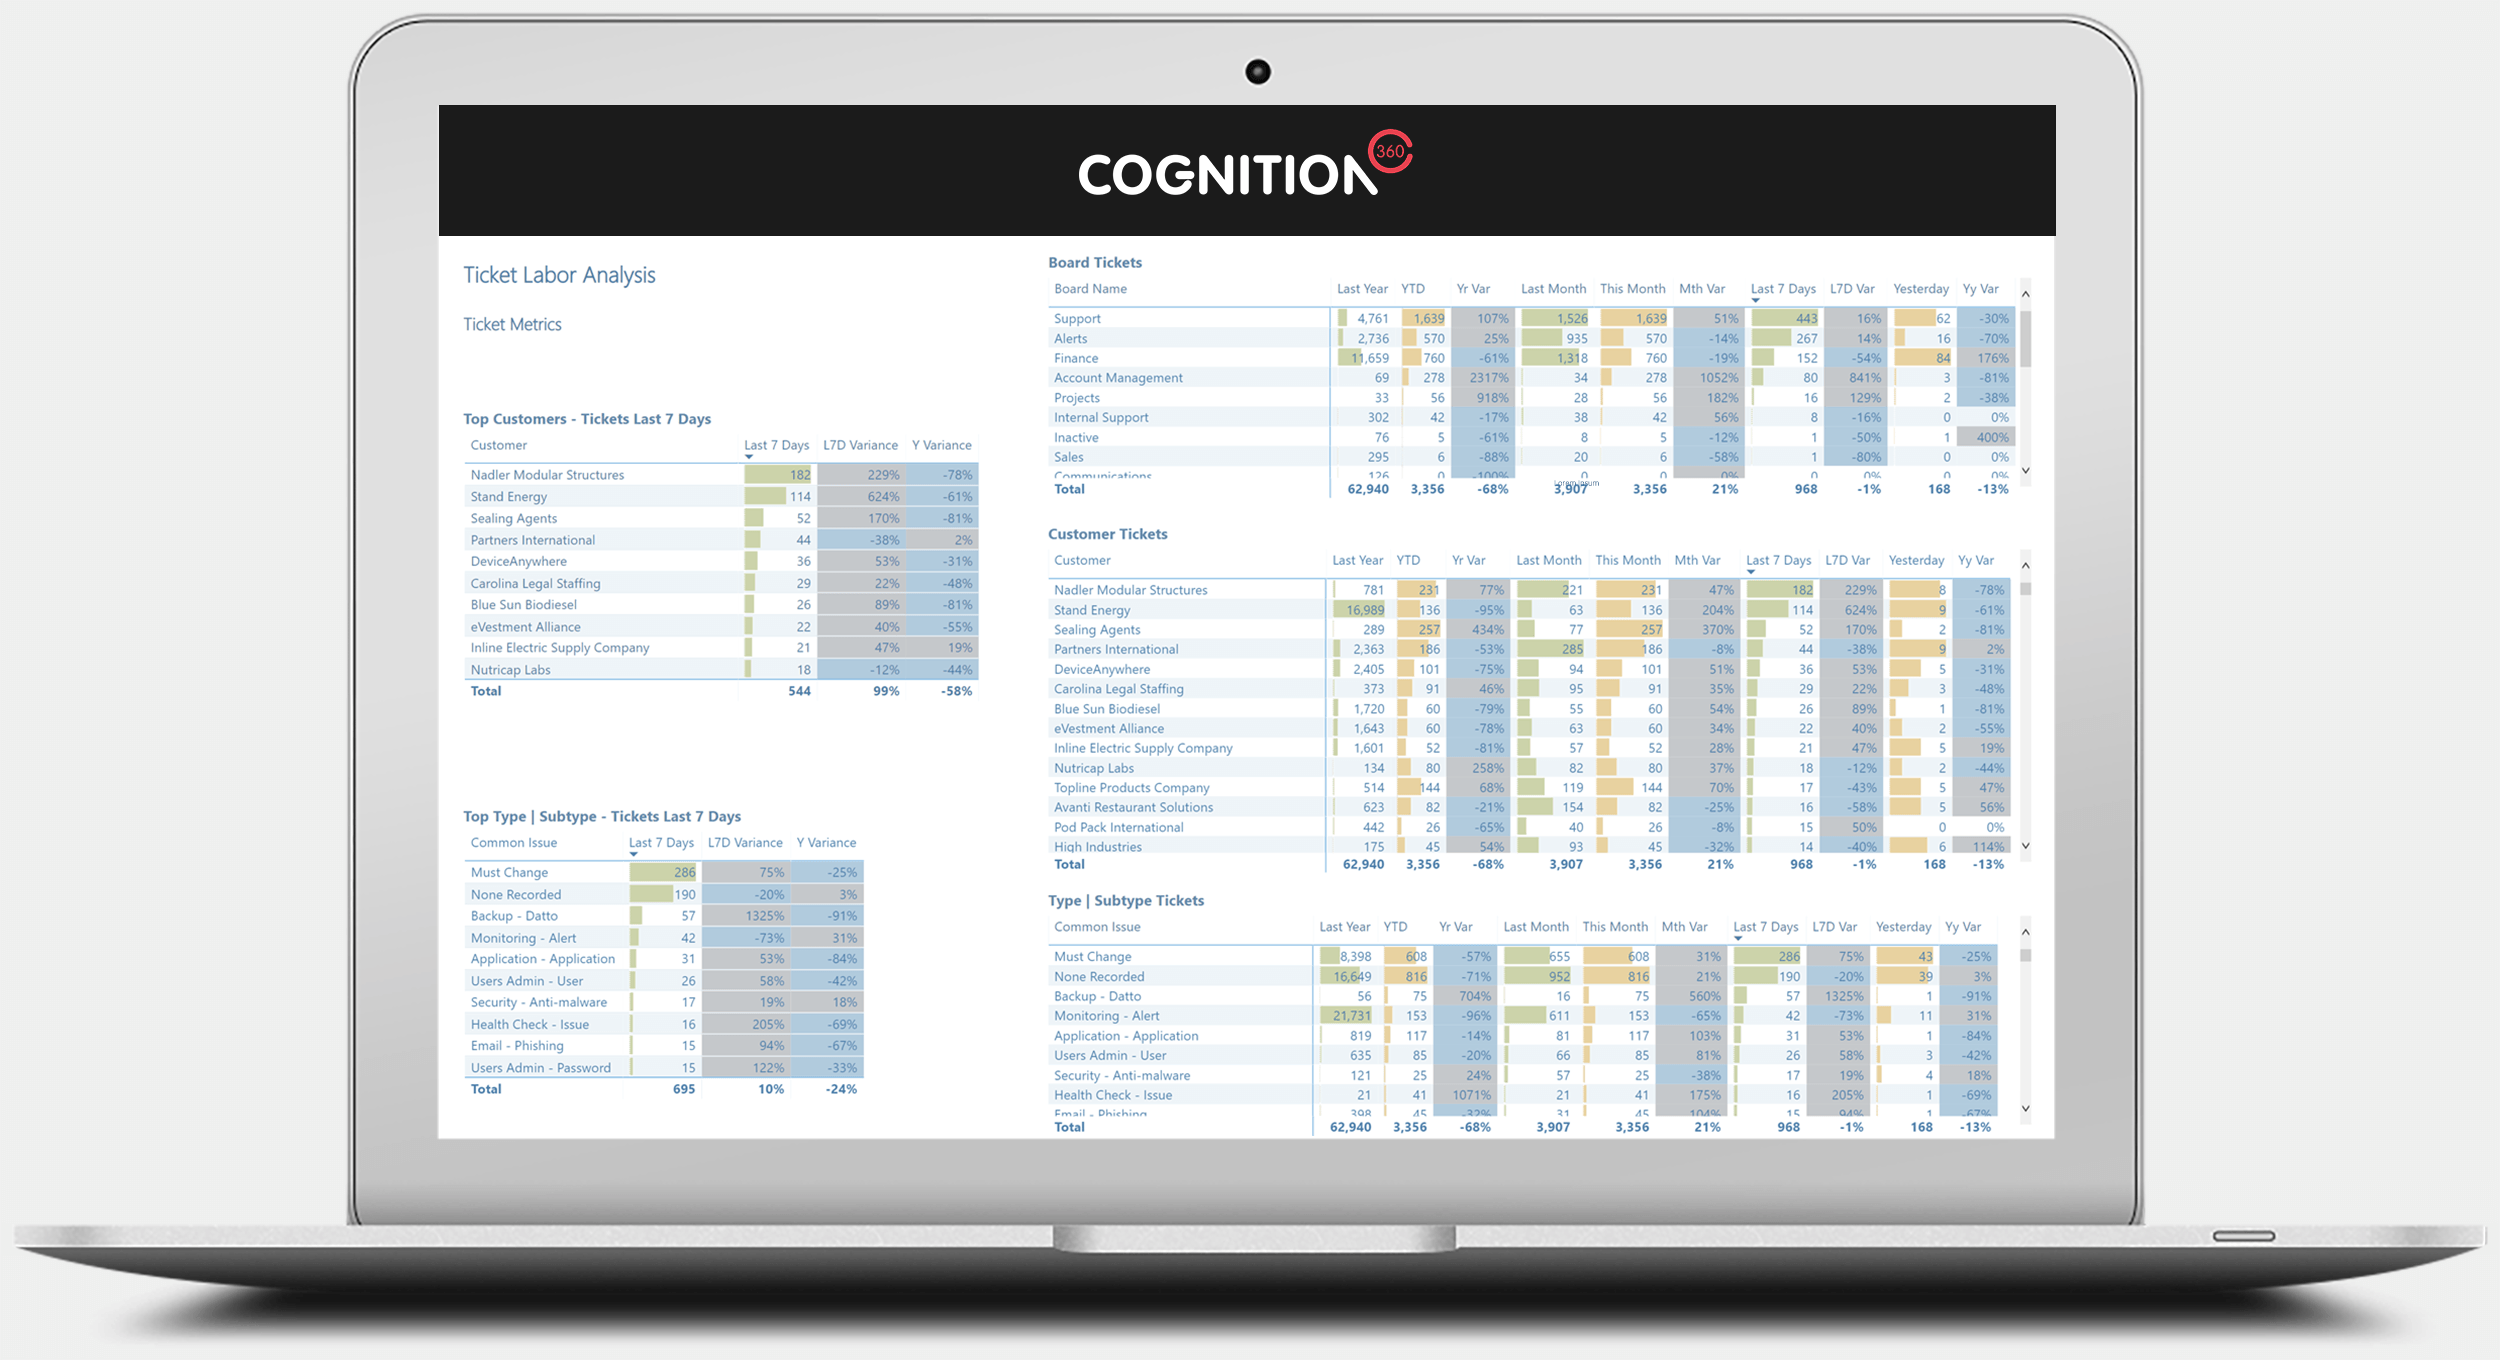
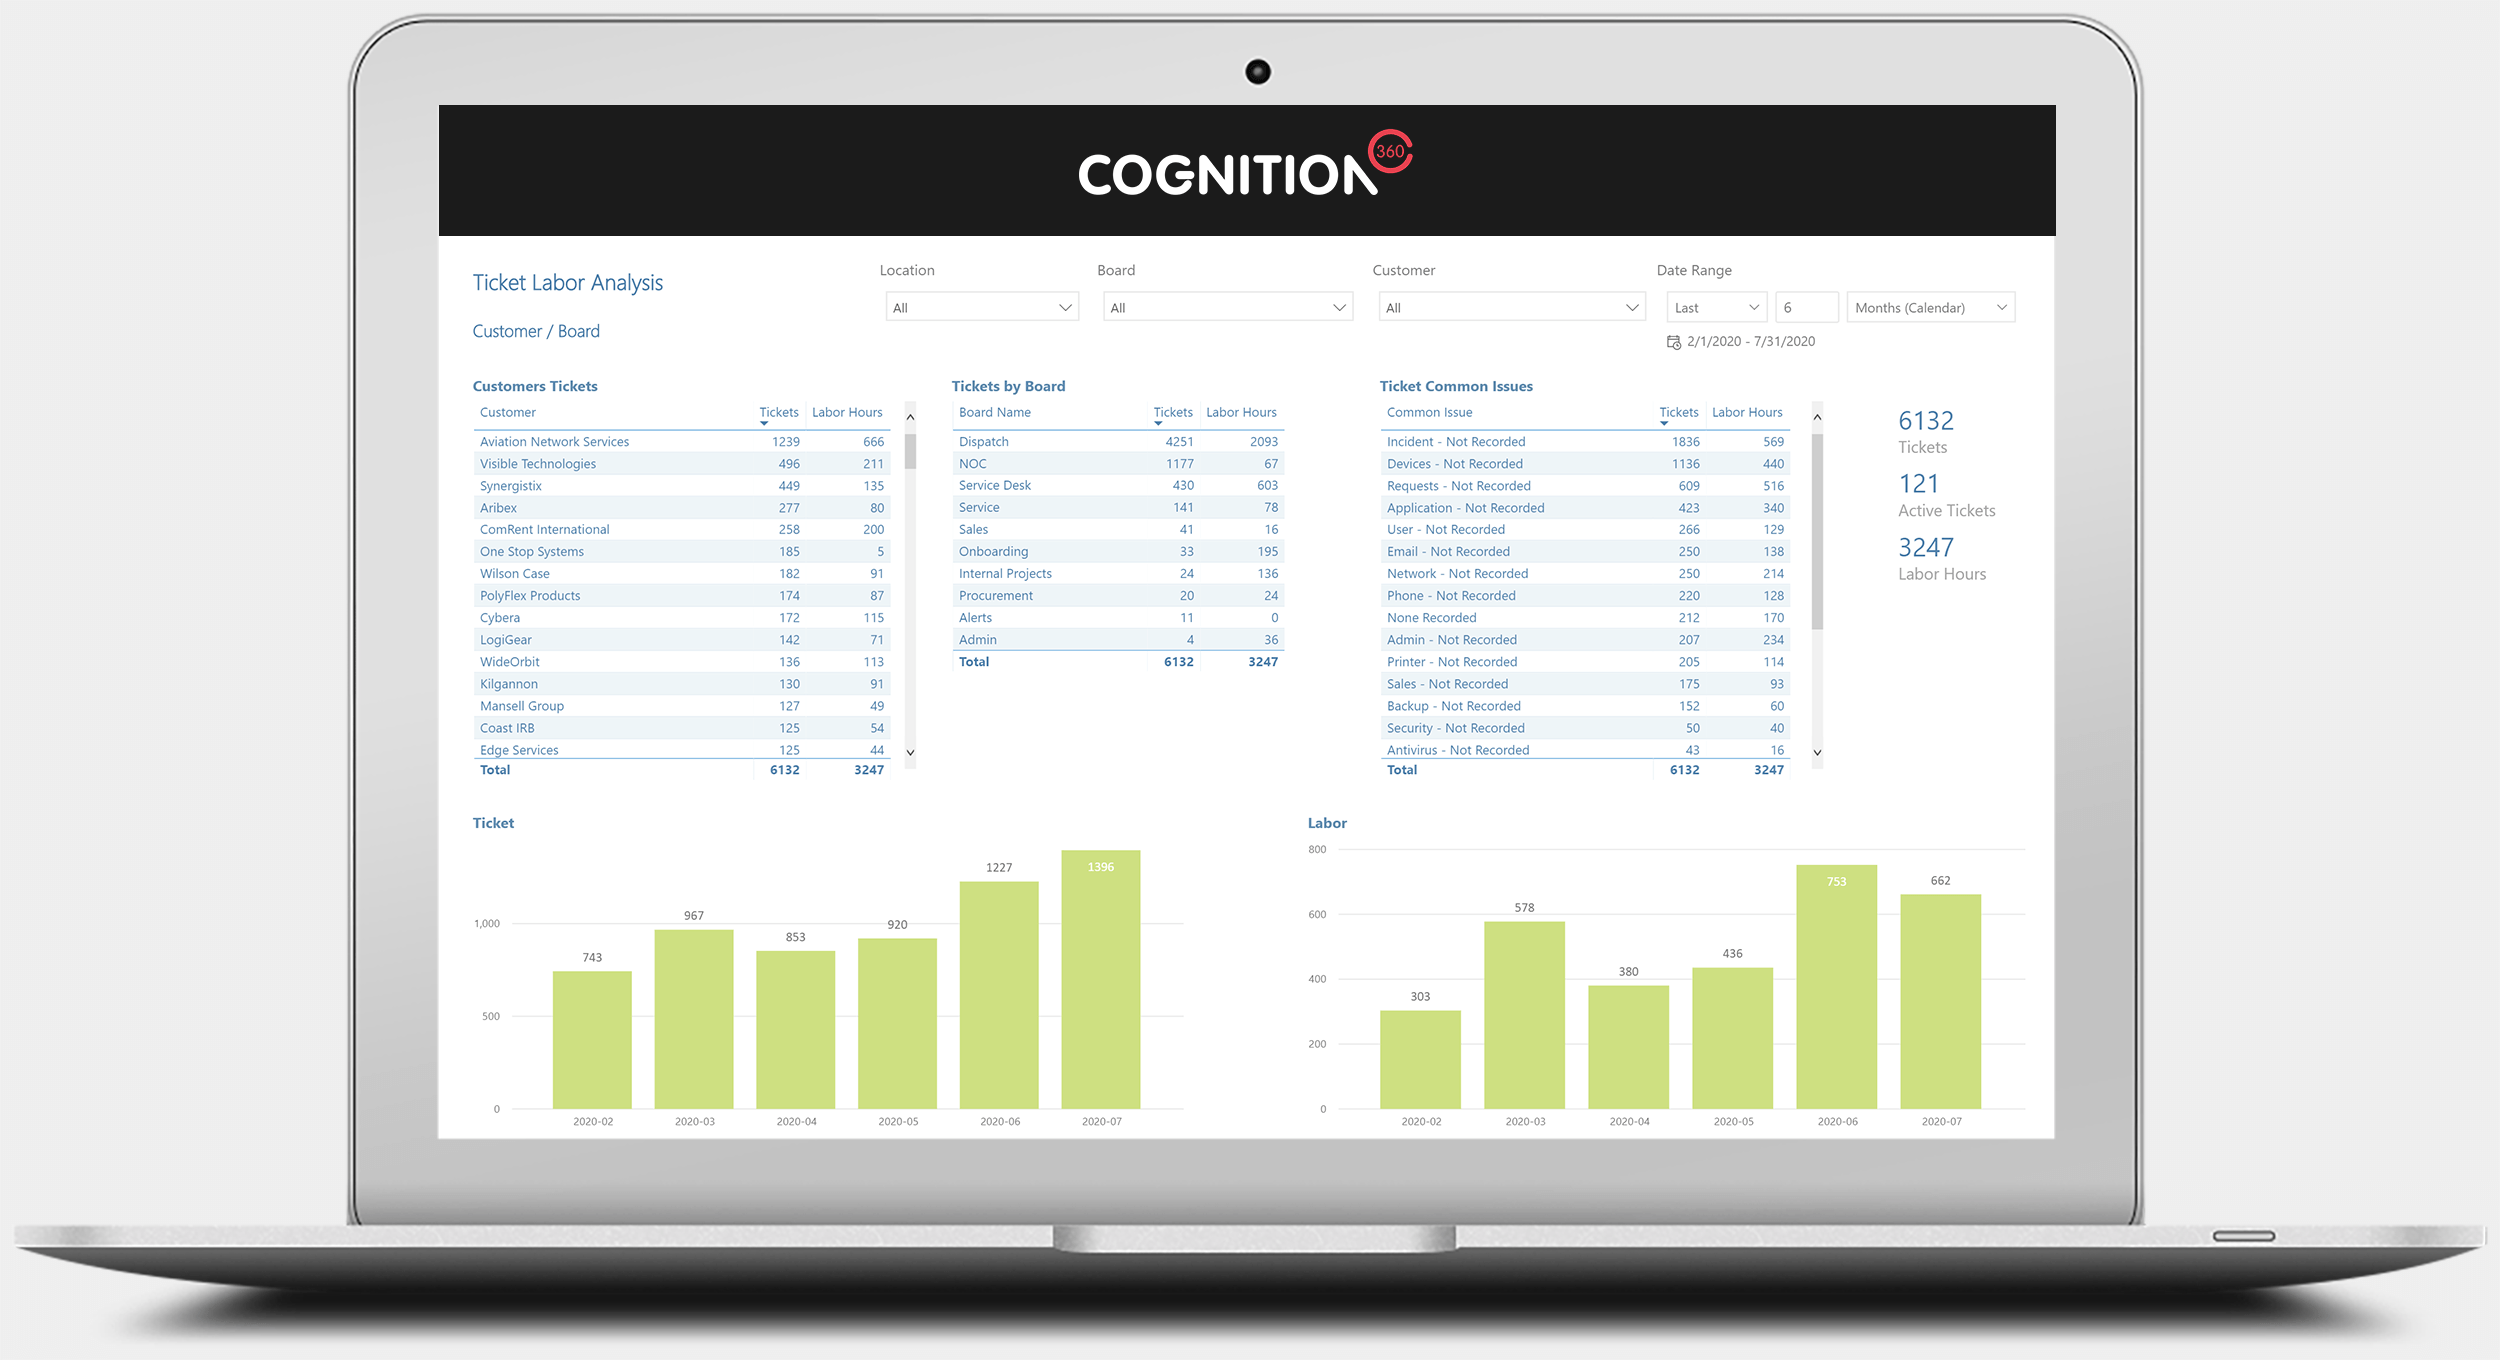
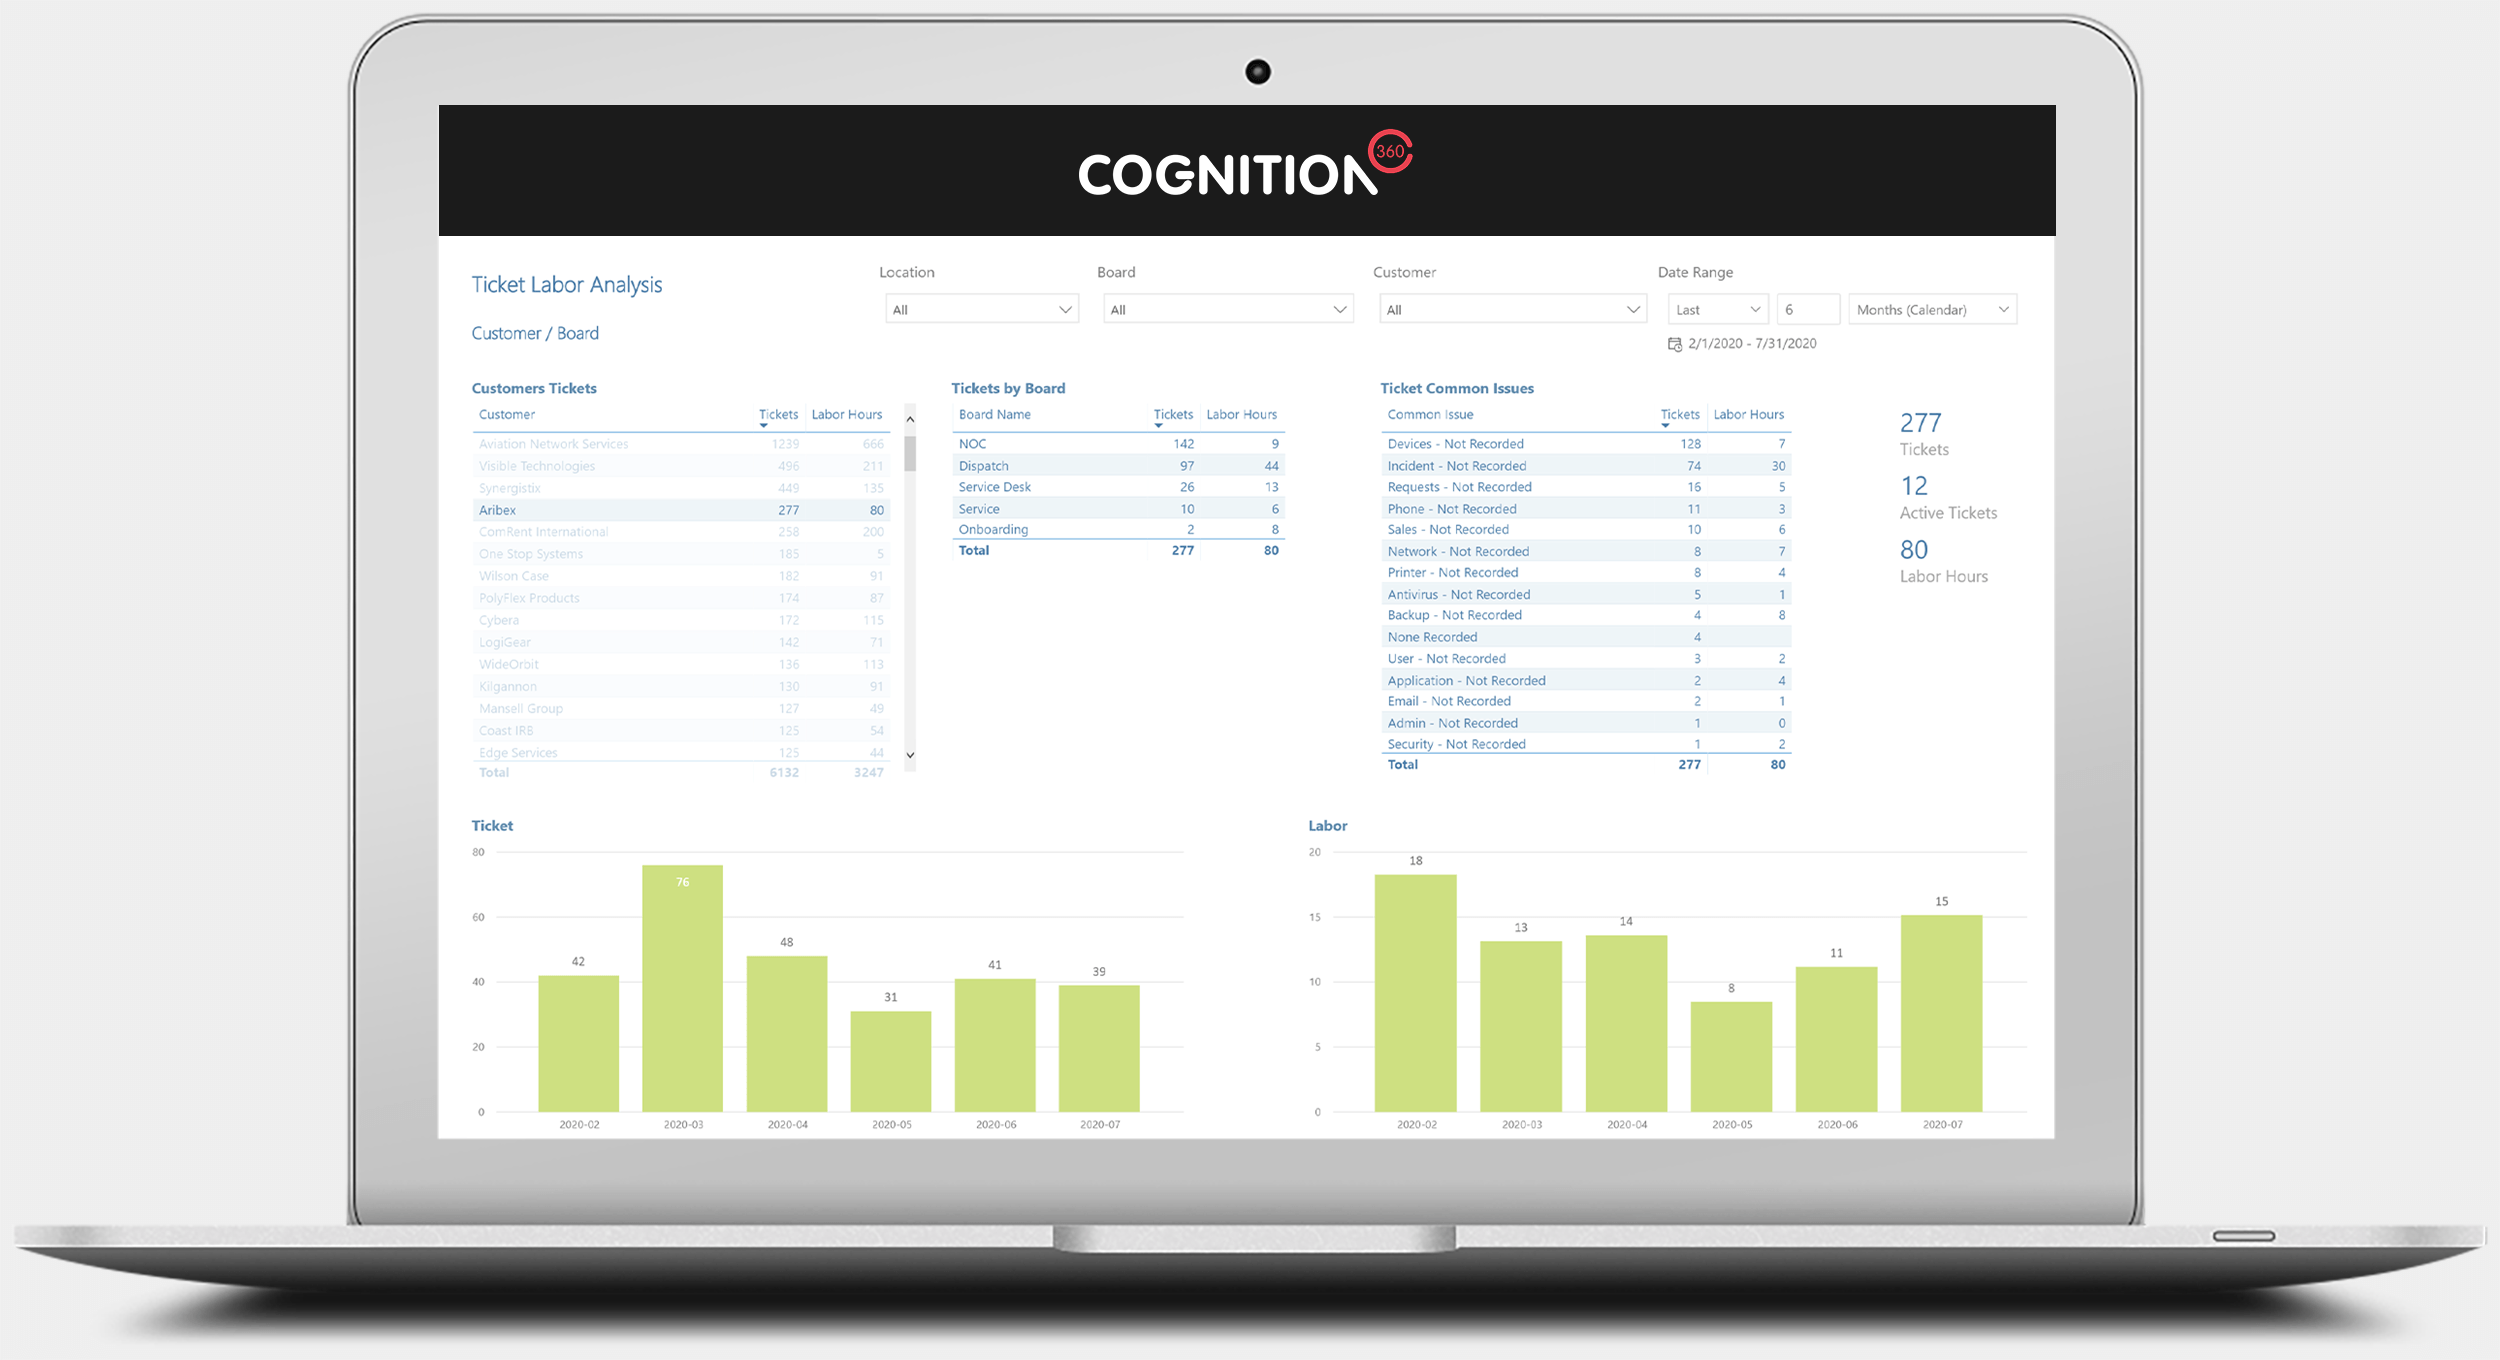
The Ticket Labor Analysis Report shows ticket and labor data split by Customer, Board and Common Issue (ticket type and subtype). View which customers are logging the most tickets, across which boards and common issue.
Image too small? See full size image
Image too small? See full size image
View: Ticket Labor Analysis – Ticket Metrics
The Ticket Metrics view lets you view ticket data for metrics on:
- tickets entered in the Last 7 days, by customer
- tickets entered in the Last 7 days, by ticket type and subtype
- ticket changes by year, month, last 7 days and yesterday – by board, customer and ticket type and subtype.
(Number of report views shown: 1)
Common Issues Report
View ticket and labor data by common issue and resource costs on labor
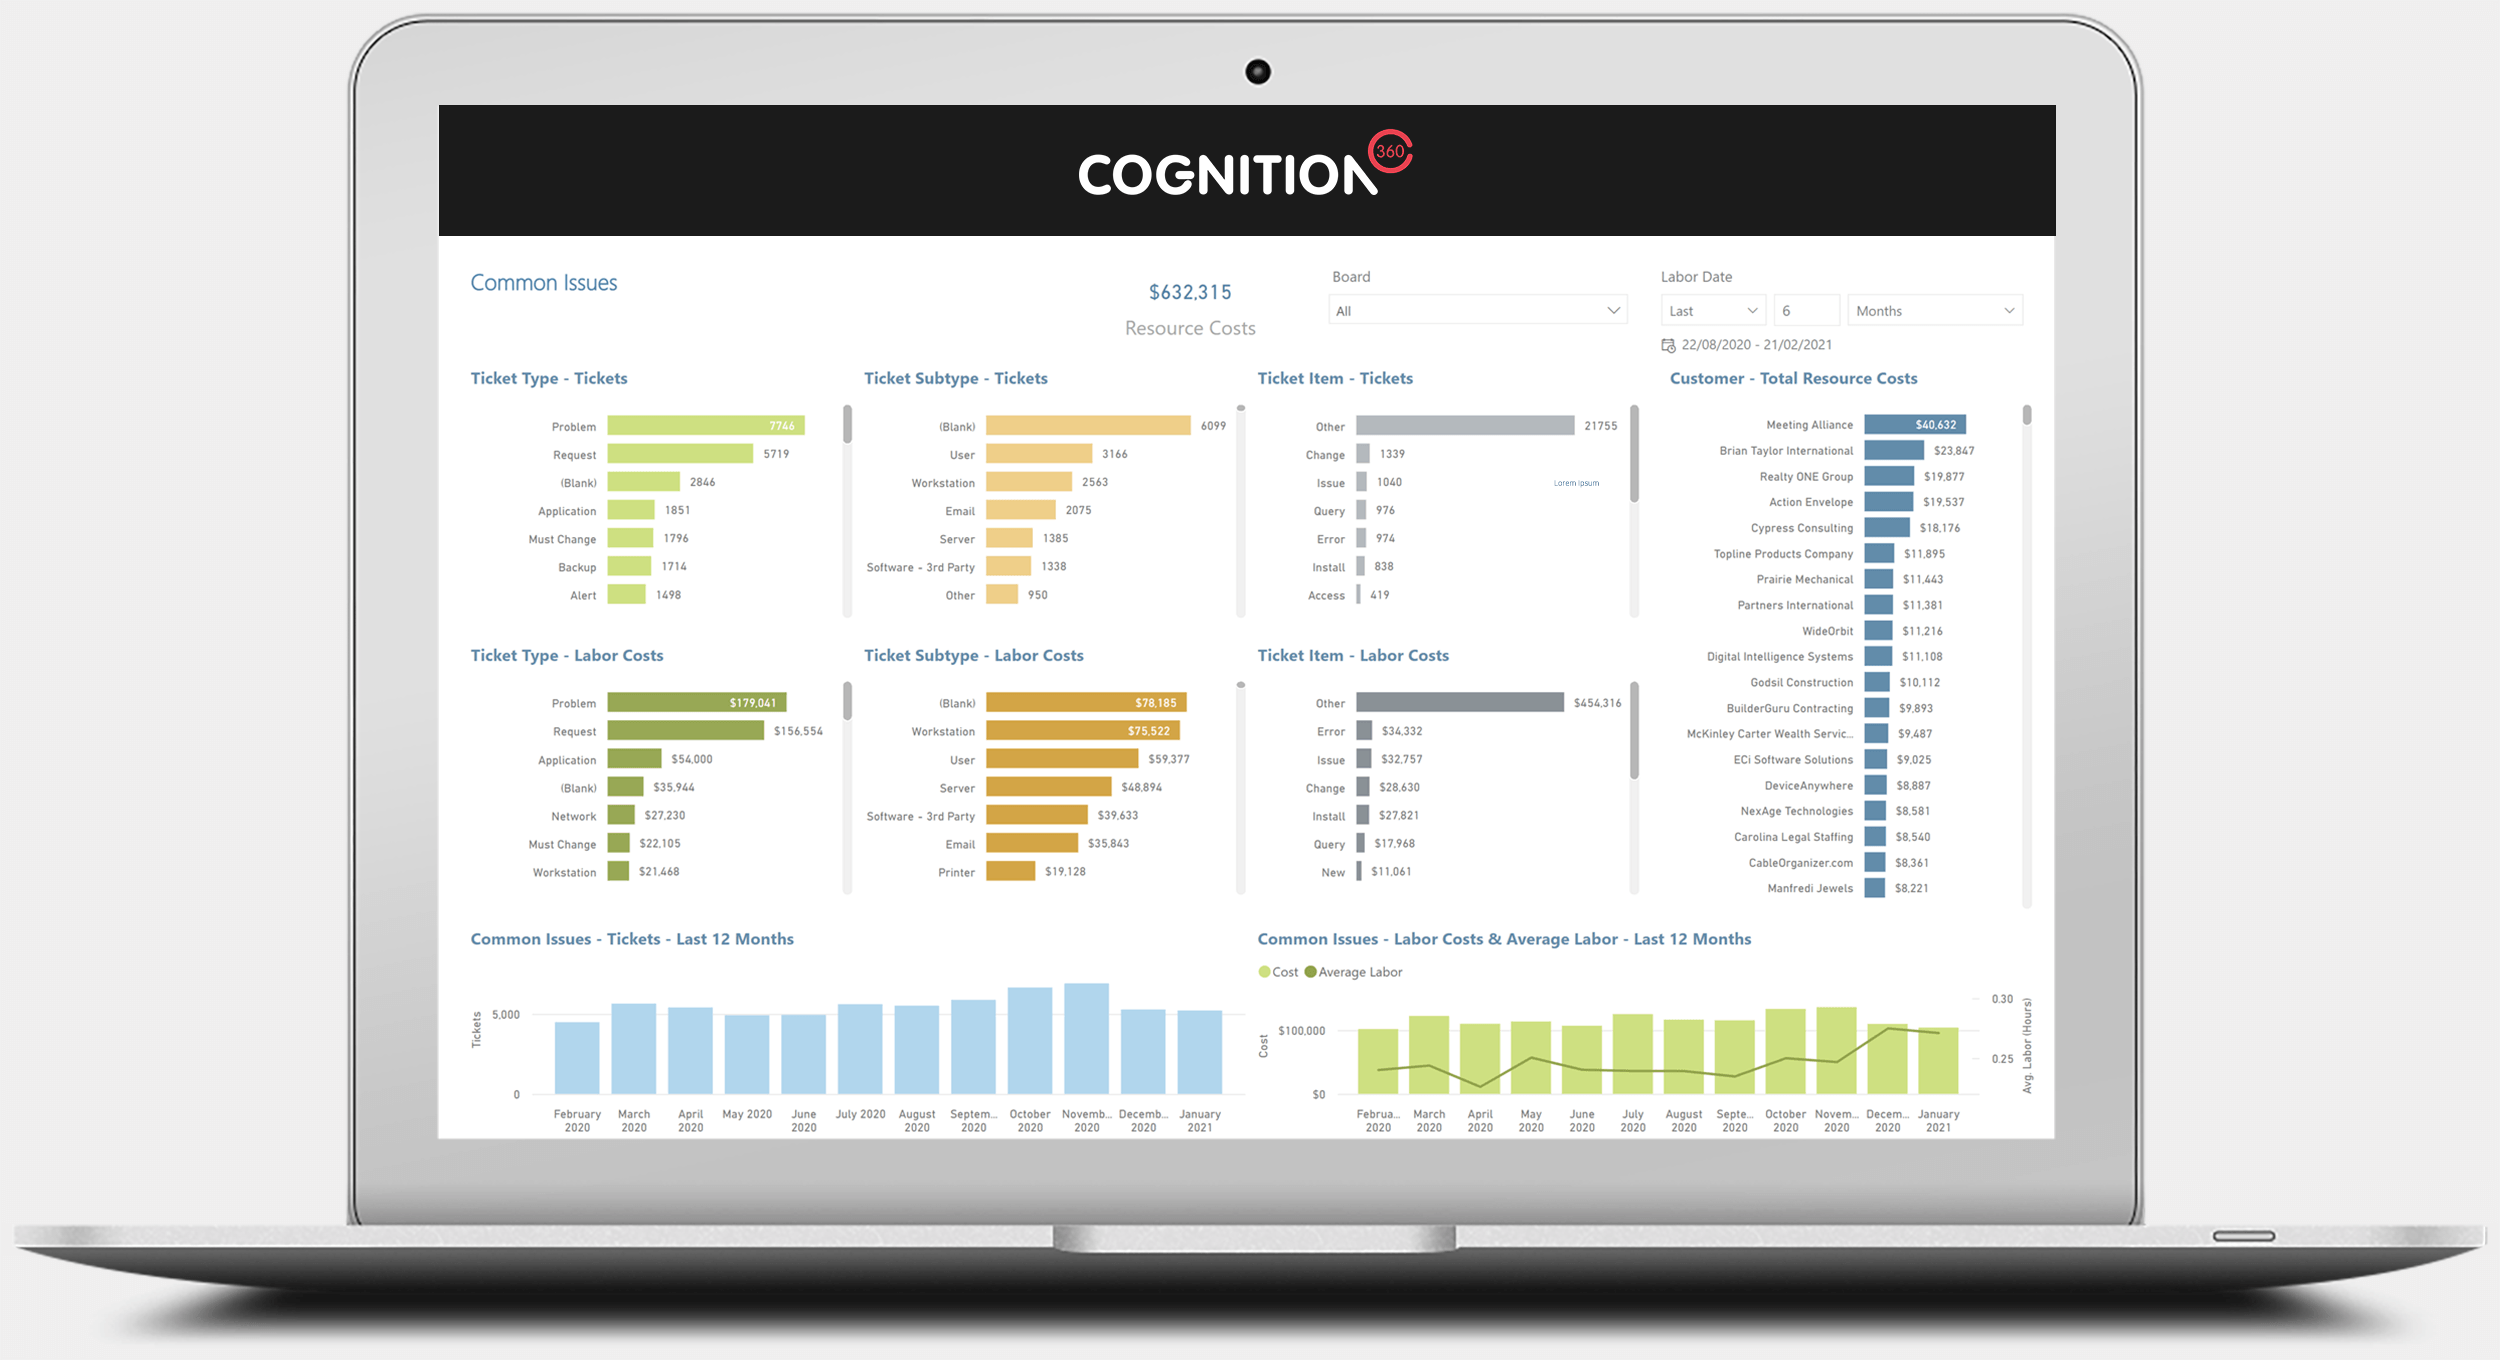
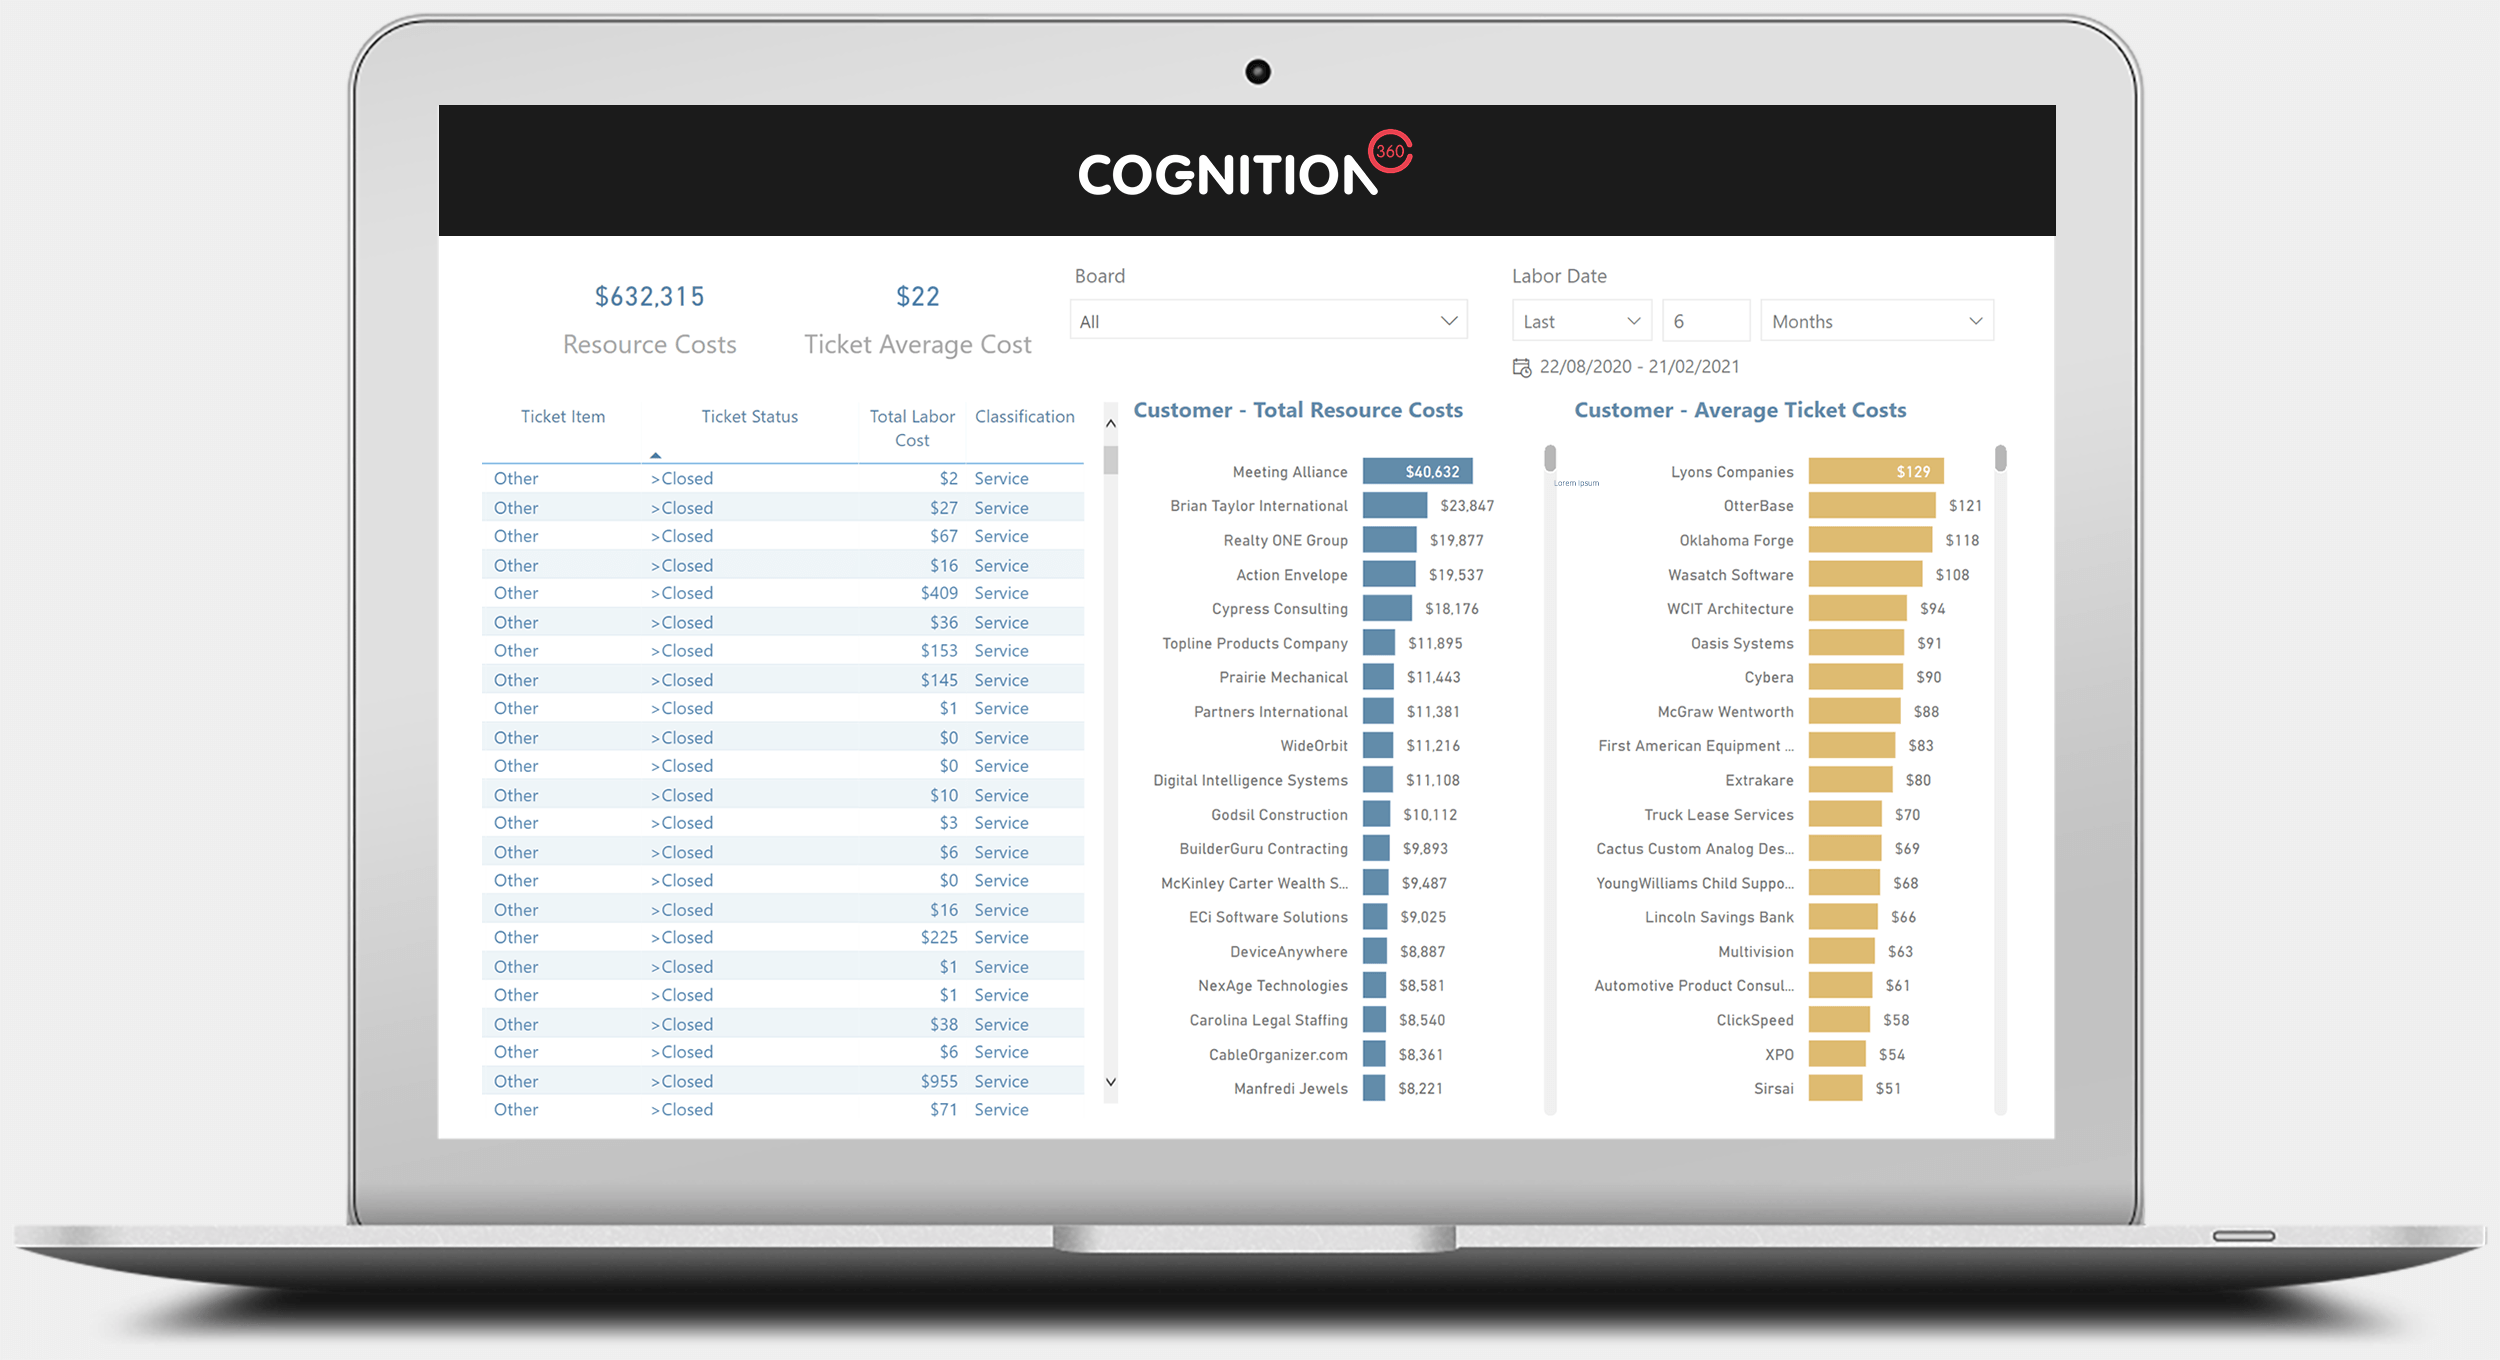
The Common Issues Report lets you report on ticket type, subtype and item. View ticket and labor data by common issue and resource costs on the labor.
View: Common Issues 1
View which customers are generating tickets across common issues and the labor costs associated. Search ticket summary for key words and view the common issues recorded – for example, see which common issues are recorded on tickets with the key word password in the ticket summary. (Number of report views shown: 1)
Image too small? See full size image
Image too small? See full size image
DECEMBER 2020
Technician Review Report
Monitor all the key metrics and KPIs of your Technical staff
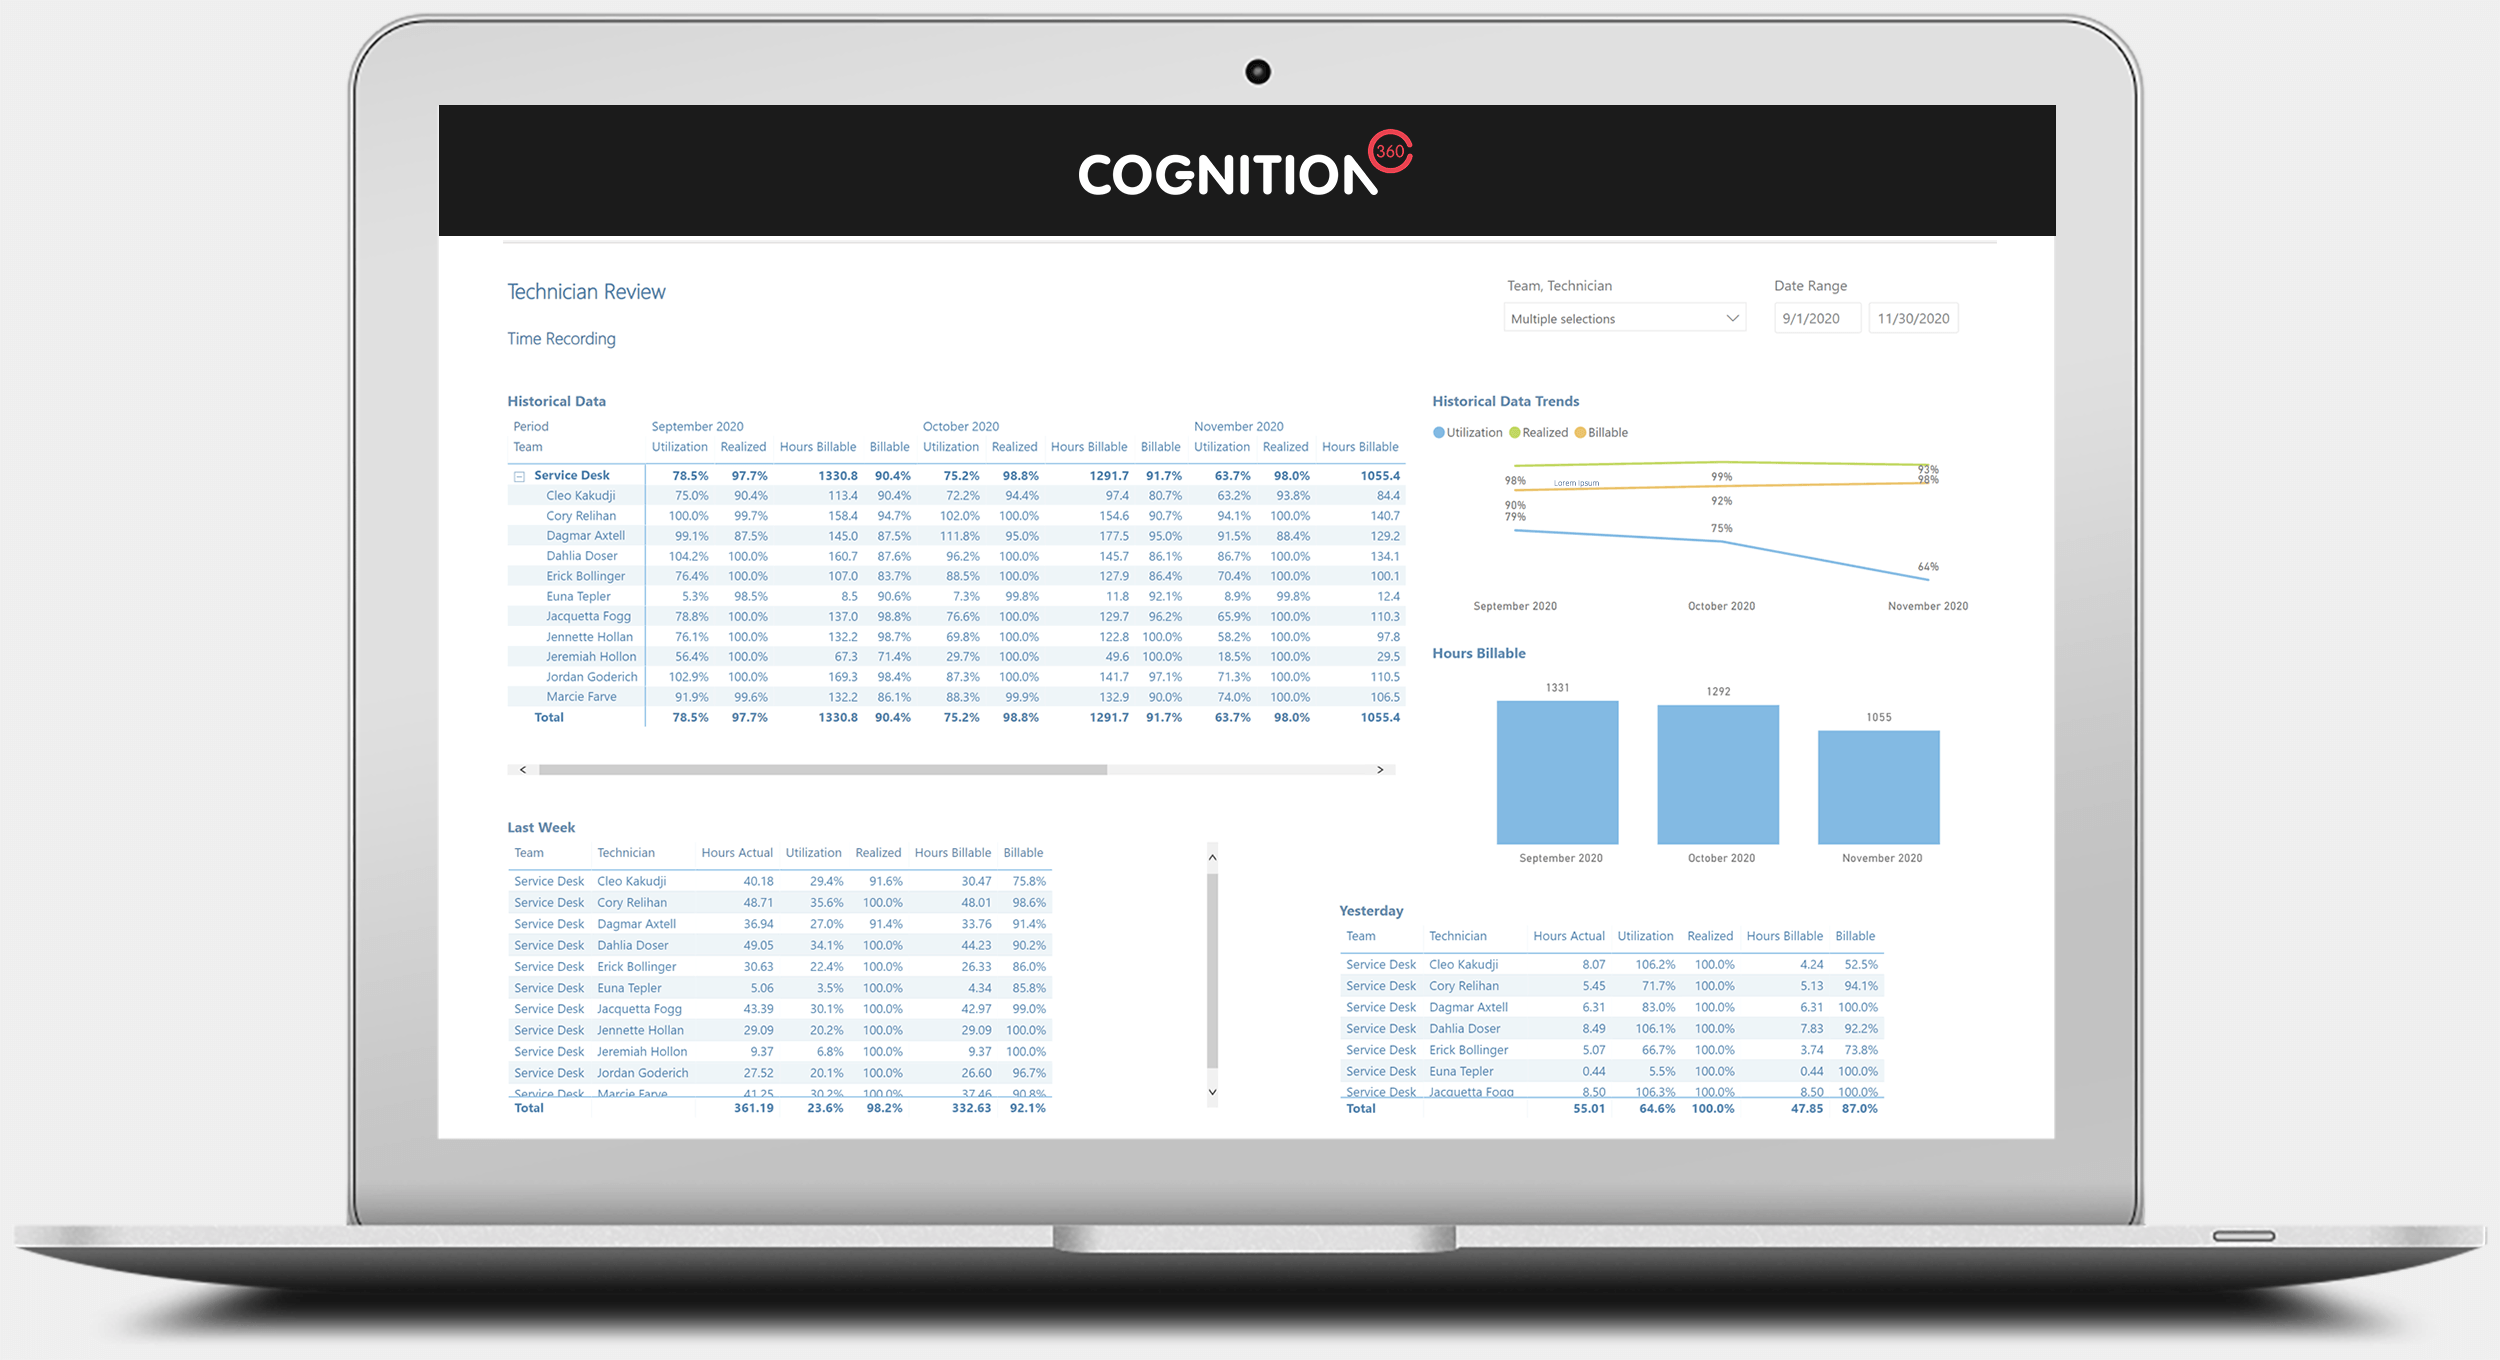
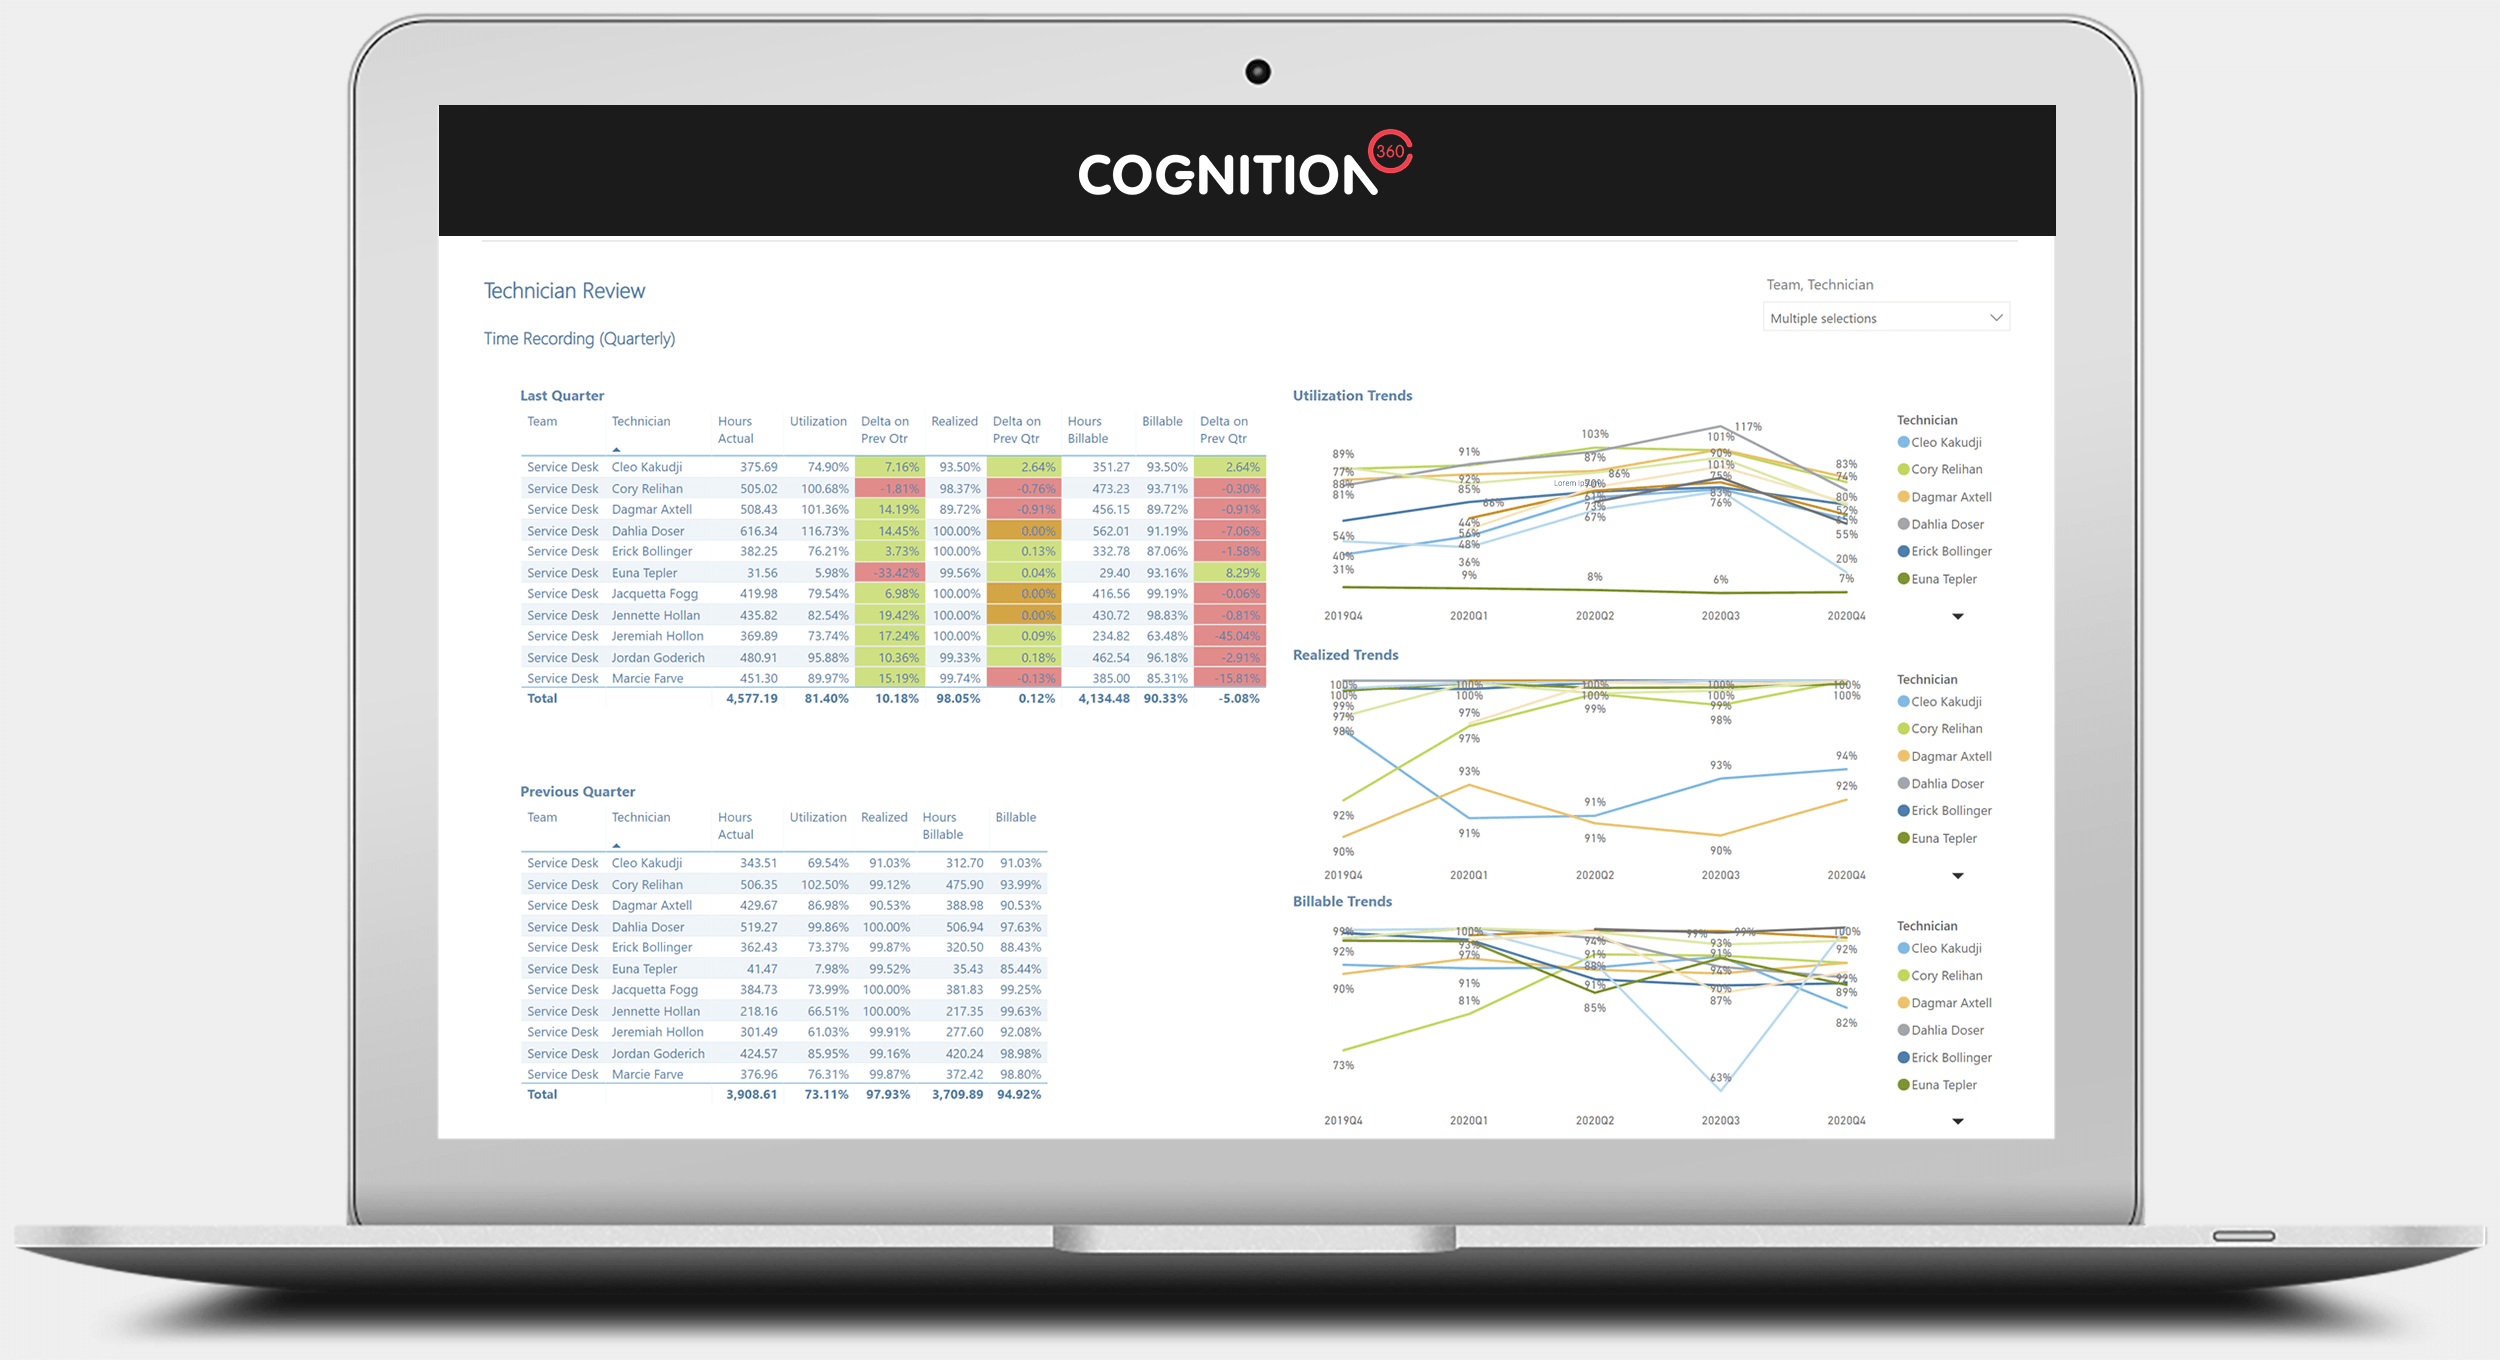
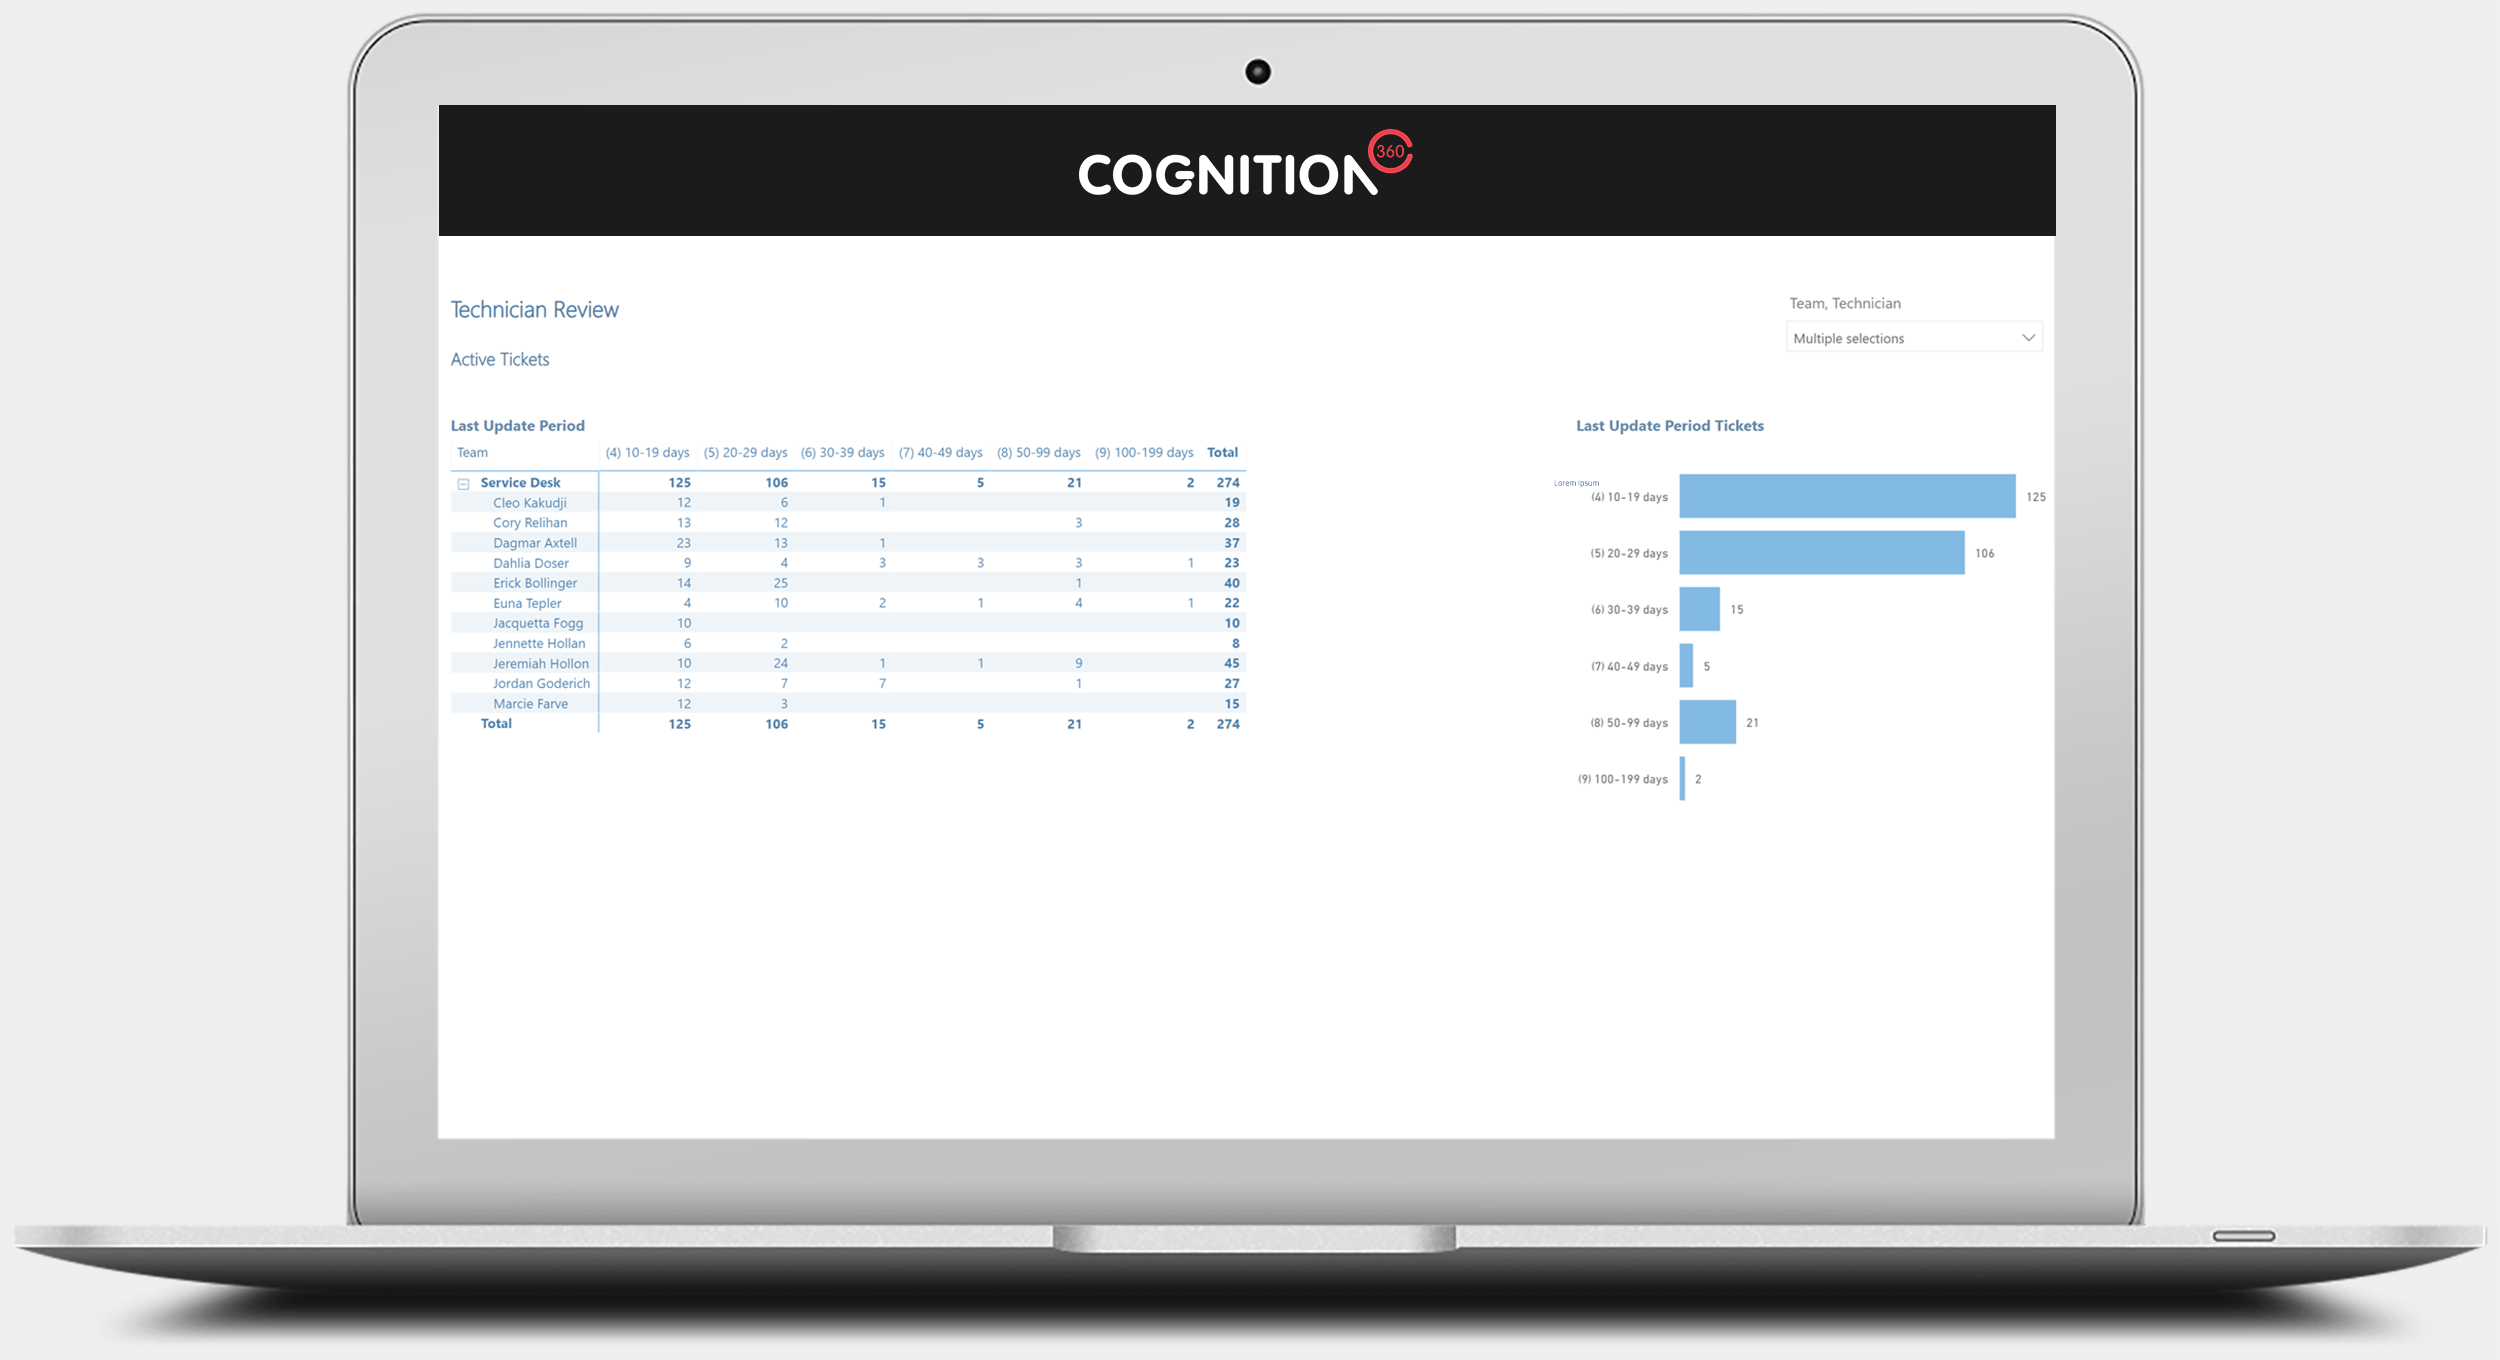
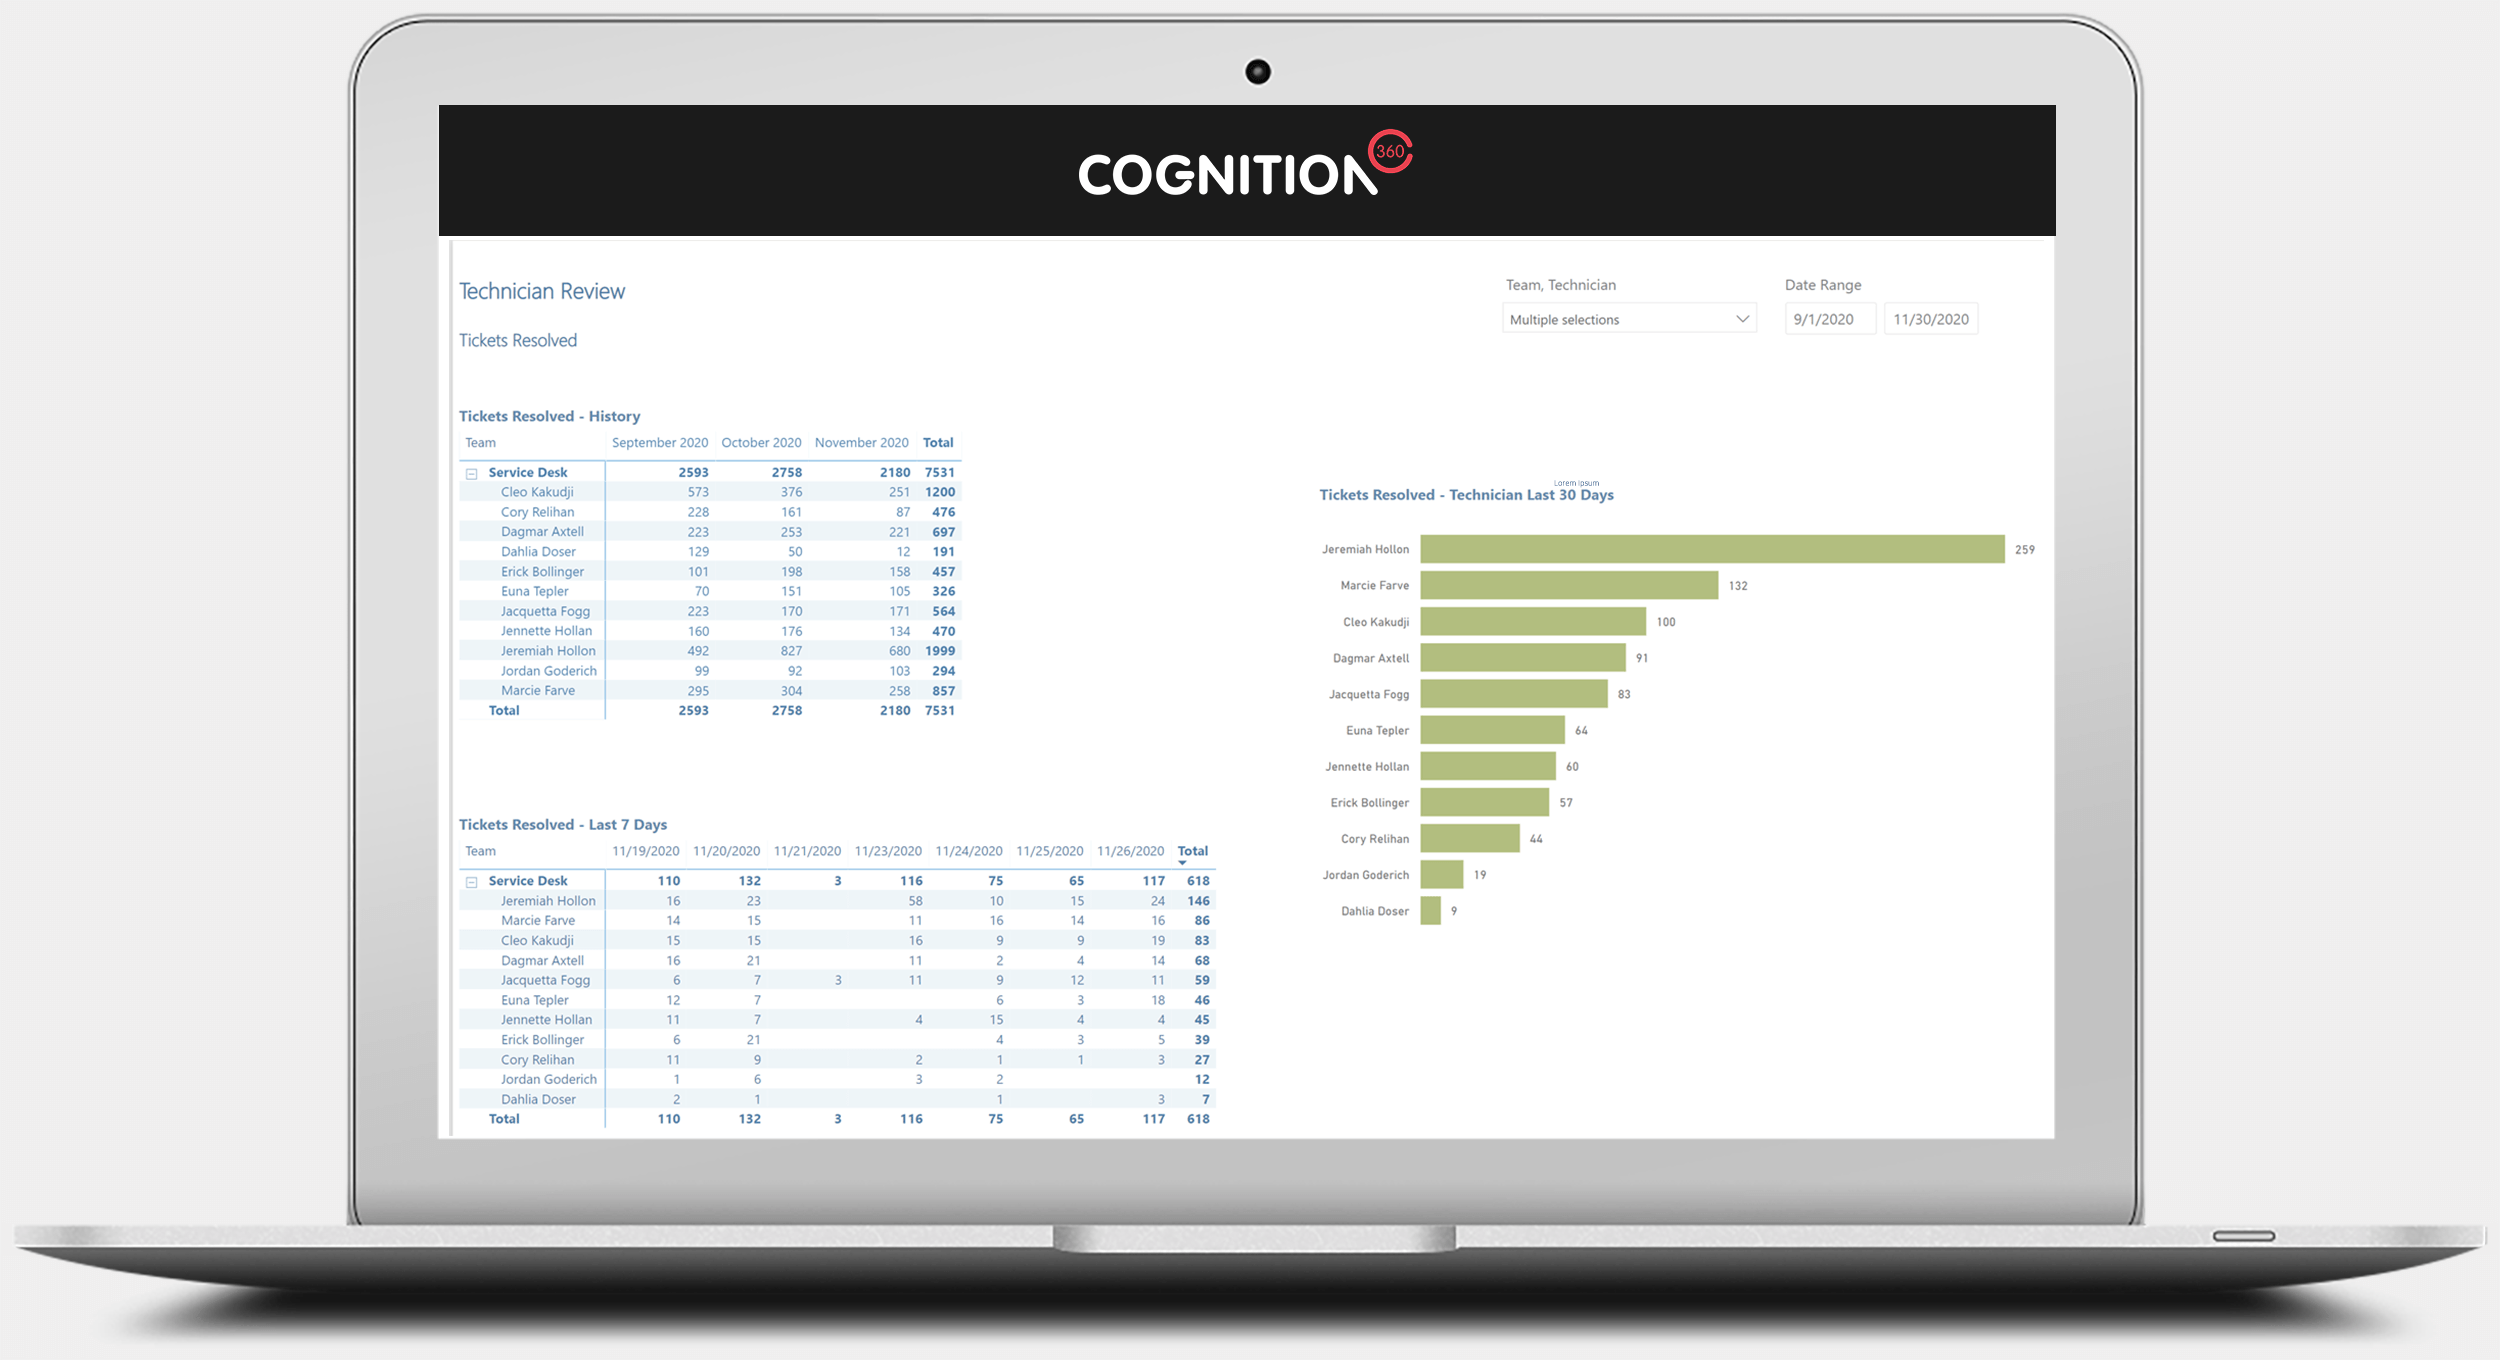
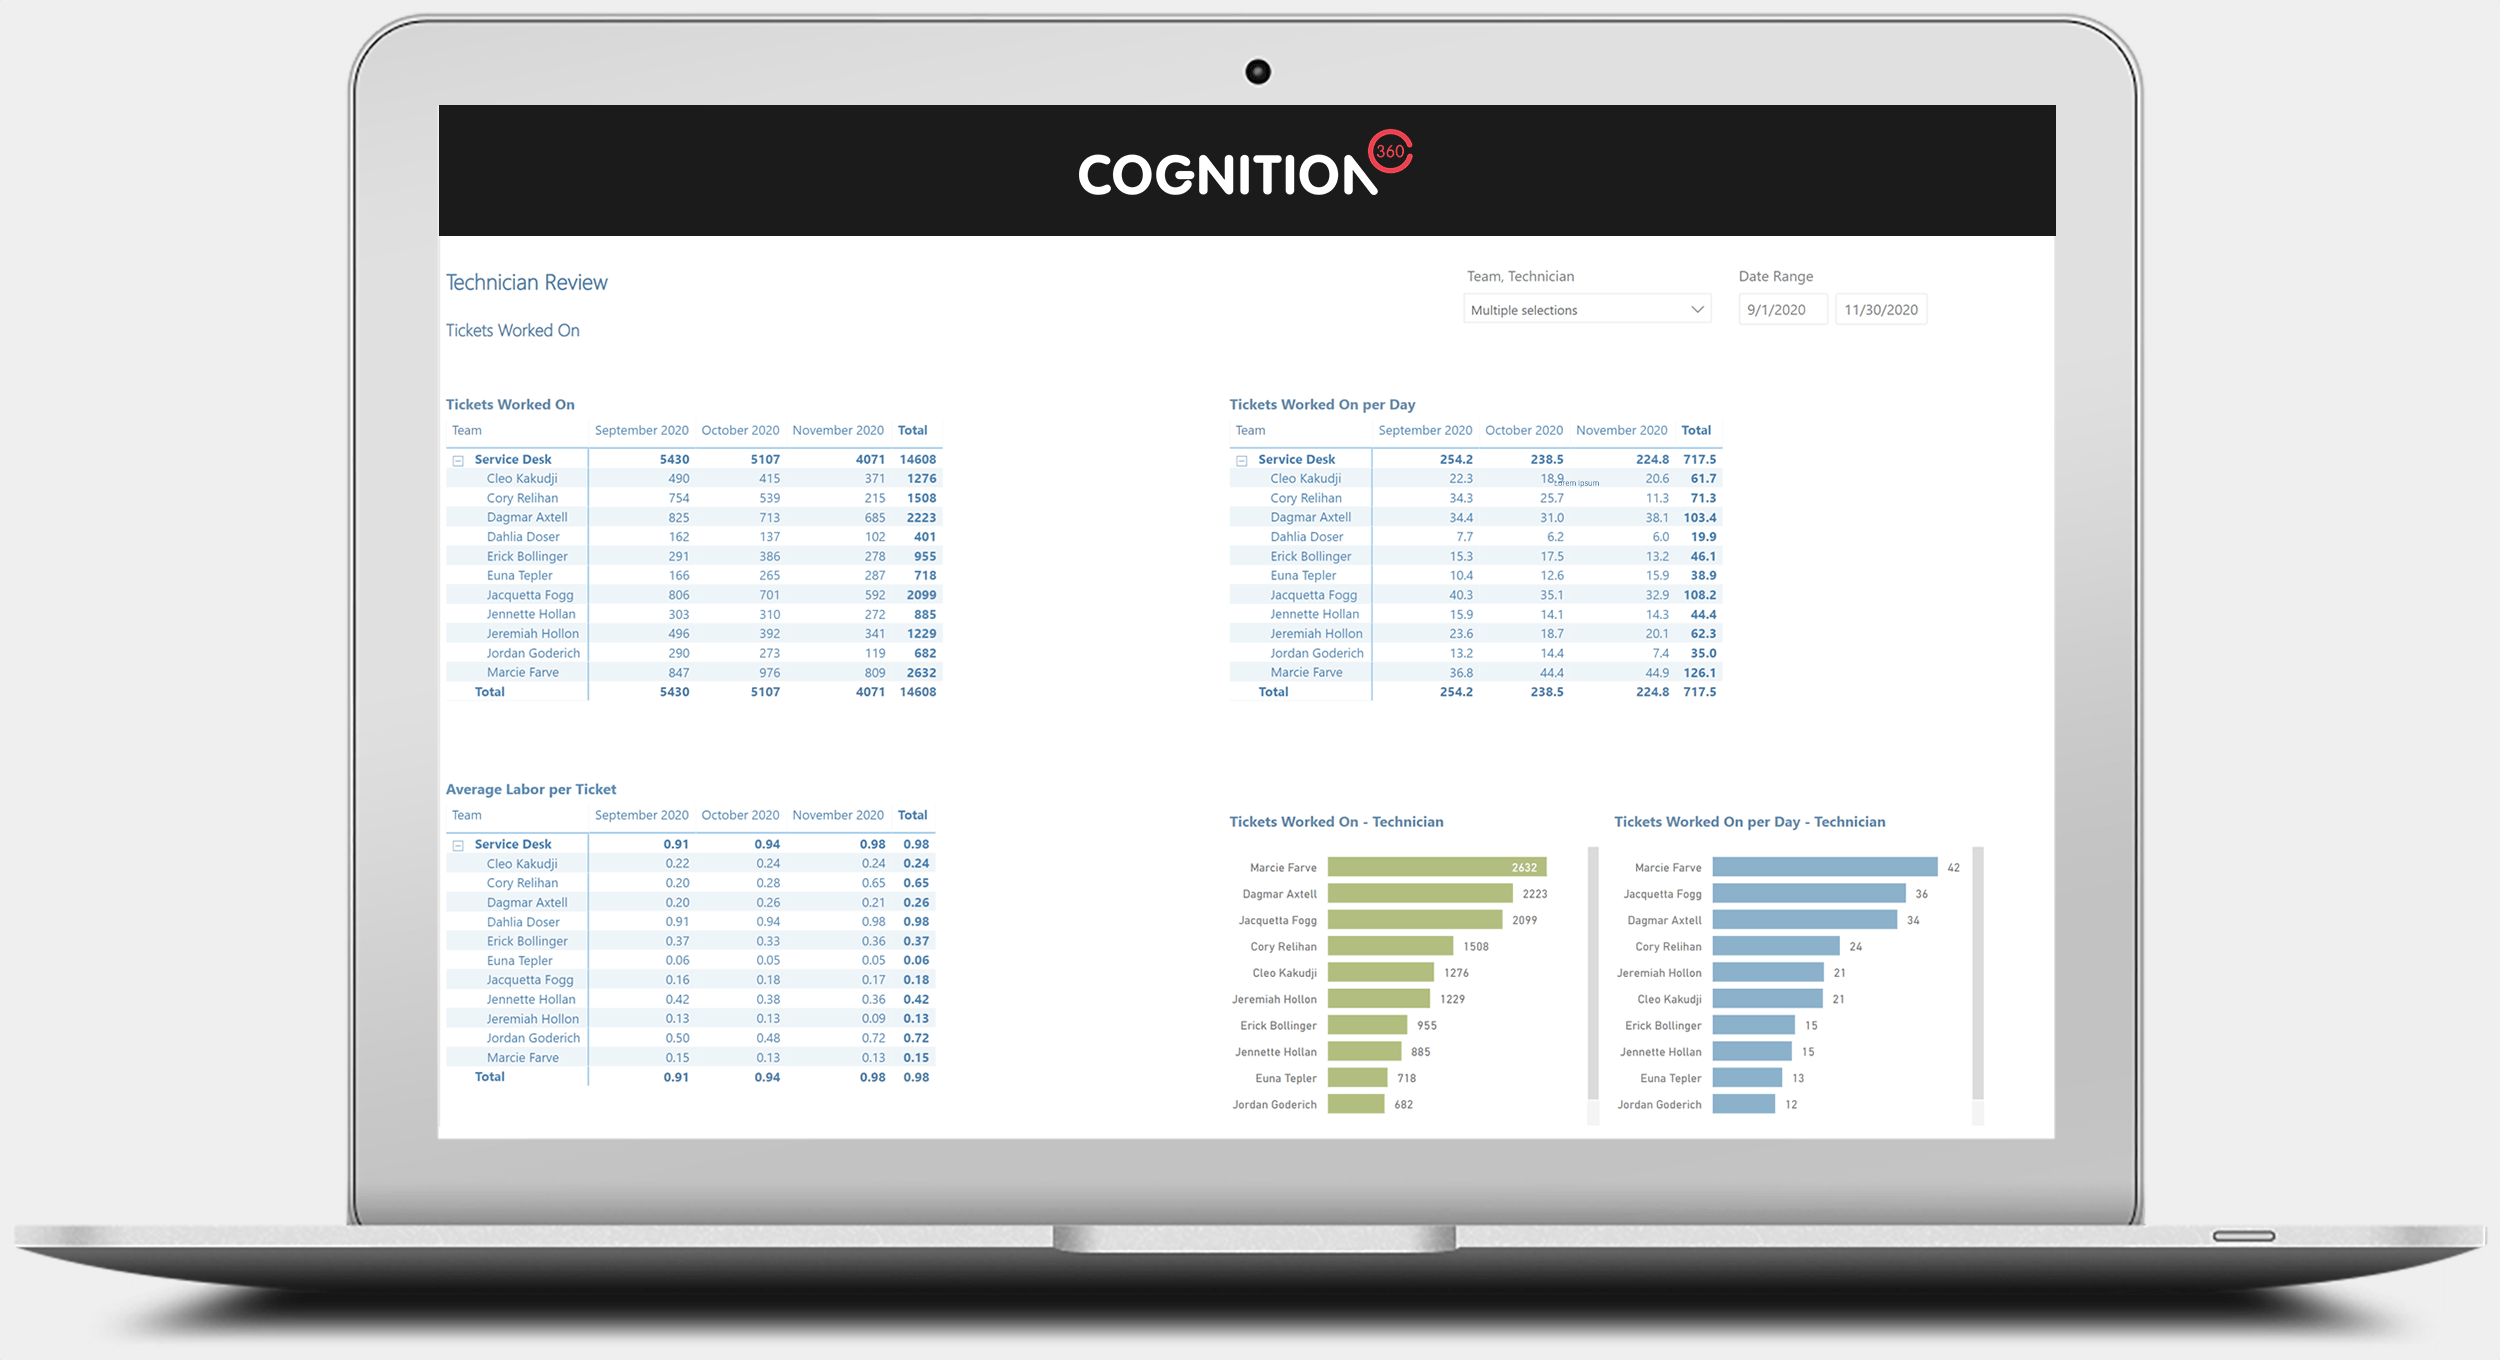
The Technician Review Report allows you to monitor all the key metrics and KPIs of your Technical staff – from time entry to current assigned active tickets. See below several views that show how you can monitor current trends, or quarter on quarter reviews. You can also review workloads across ticket types and work types.
View: Time Recording
The Time Recording report view allows you to review team time entry data for month on month and current periods, to help you spot trends in Utilized, Realized and Billable data. (Number of report views shown: 1)
Image too small? See full size image
View: Time Recording Quarterly
The Time Recording Quarterly report view reviews trends for the last and previous quarter, revealing trends in Utilized, Realized and Billable data. (Number of report views shown: 1)
Image too small? See full size image
View: Active Tickets
The Active Tickets report view enables you to review active ticket data by Team and Technician. See data for stale tickets, by resource. (Number of report views shown: 1)
Image too small? See full size image
View: Tickets Resolved
The Tickets Resolved report view allows you to review resolved ticket volumes, month on month and for the current period. (Number of report views shown: 1)
Image too small? See full size image
View: Tickets Worked On
The Tickets Worked On report view lets you review ticket data for recorded labor. You can see monthly and per day values, and also discover average labor per ticket. (Number of report views shown: 1)
Image too small? See full size image
NOVEMBER 2020
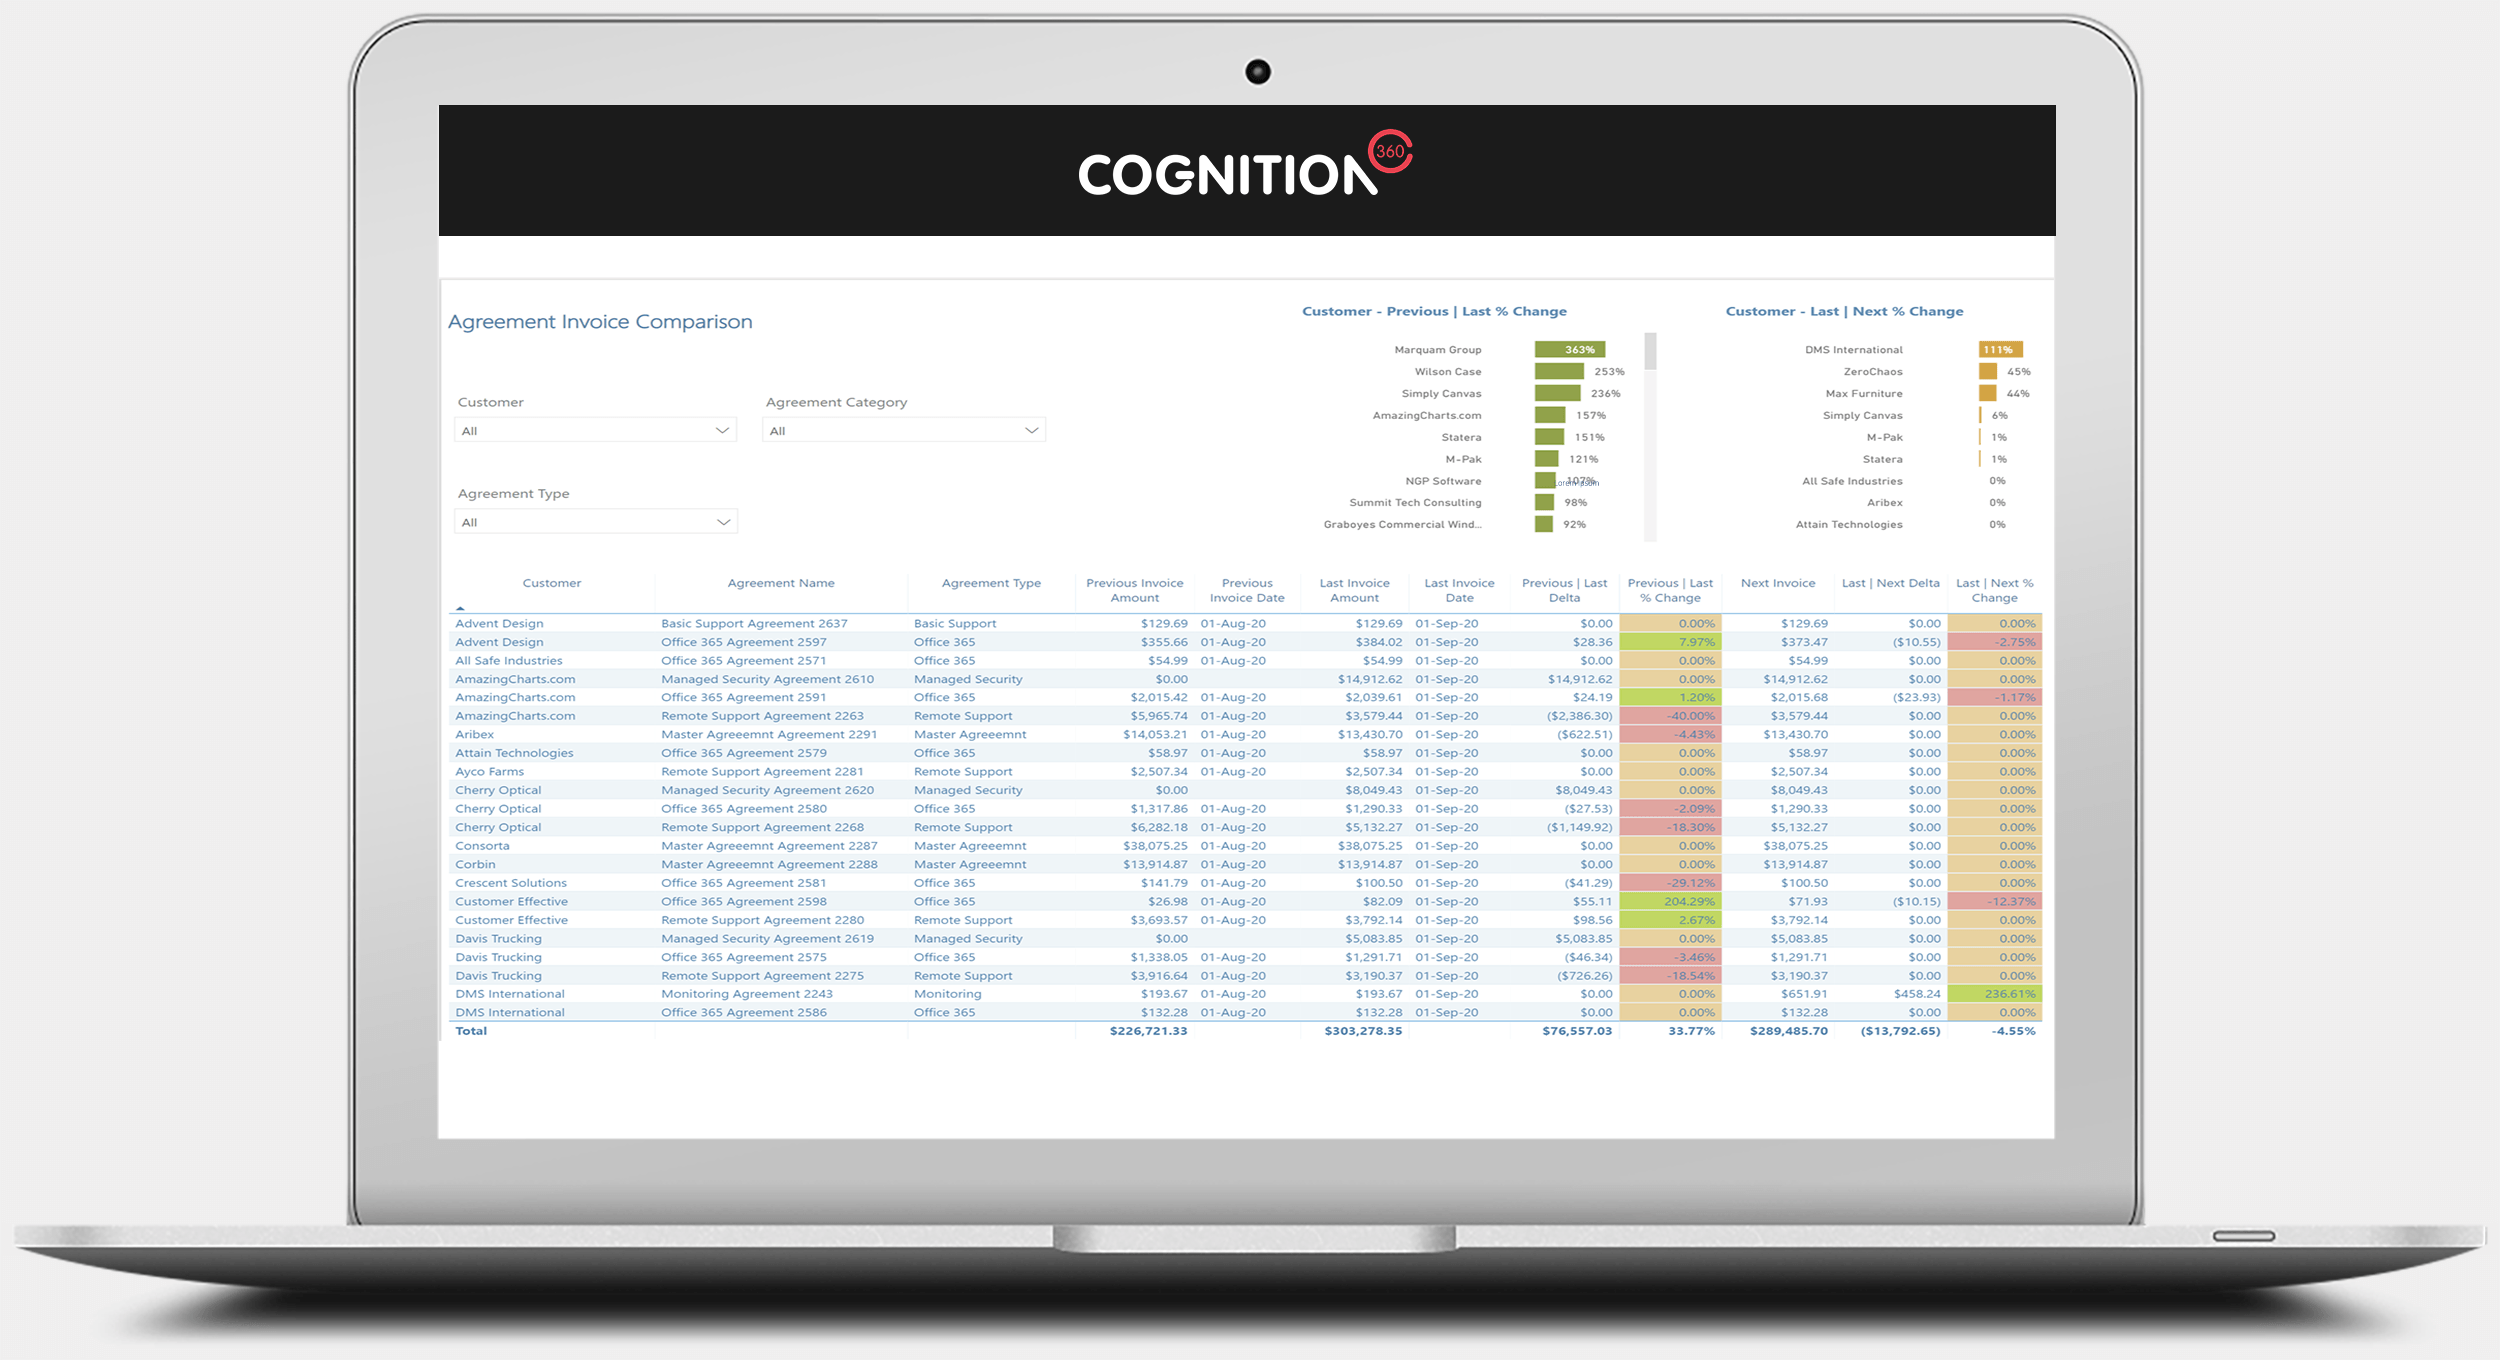
Agreement Invoice Comparison Report
Report by agreement the previous and last invoiced amounts and the next invoice amounts
The Agreement Invoice Comparison report allows the user to quickly see which agreements will have a difference in invoice amount on the next invoice compare to the last amount invoiced.
Report can be viewed prior to invoice generation and any incorrect differences can be corrected before the invoice is generated. (Number of report views shown: 1)
Image too small? See full size image
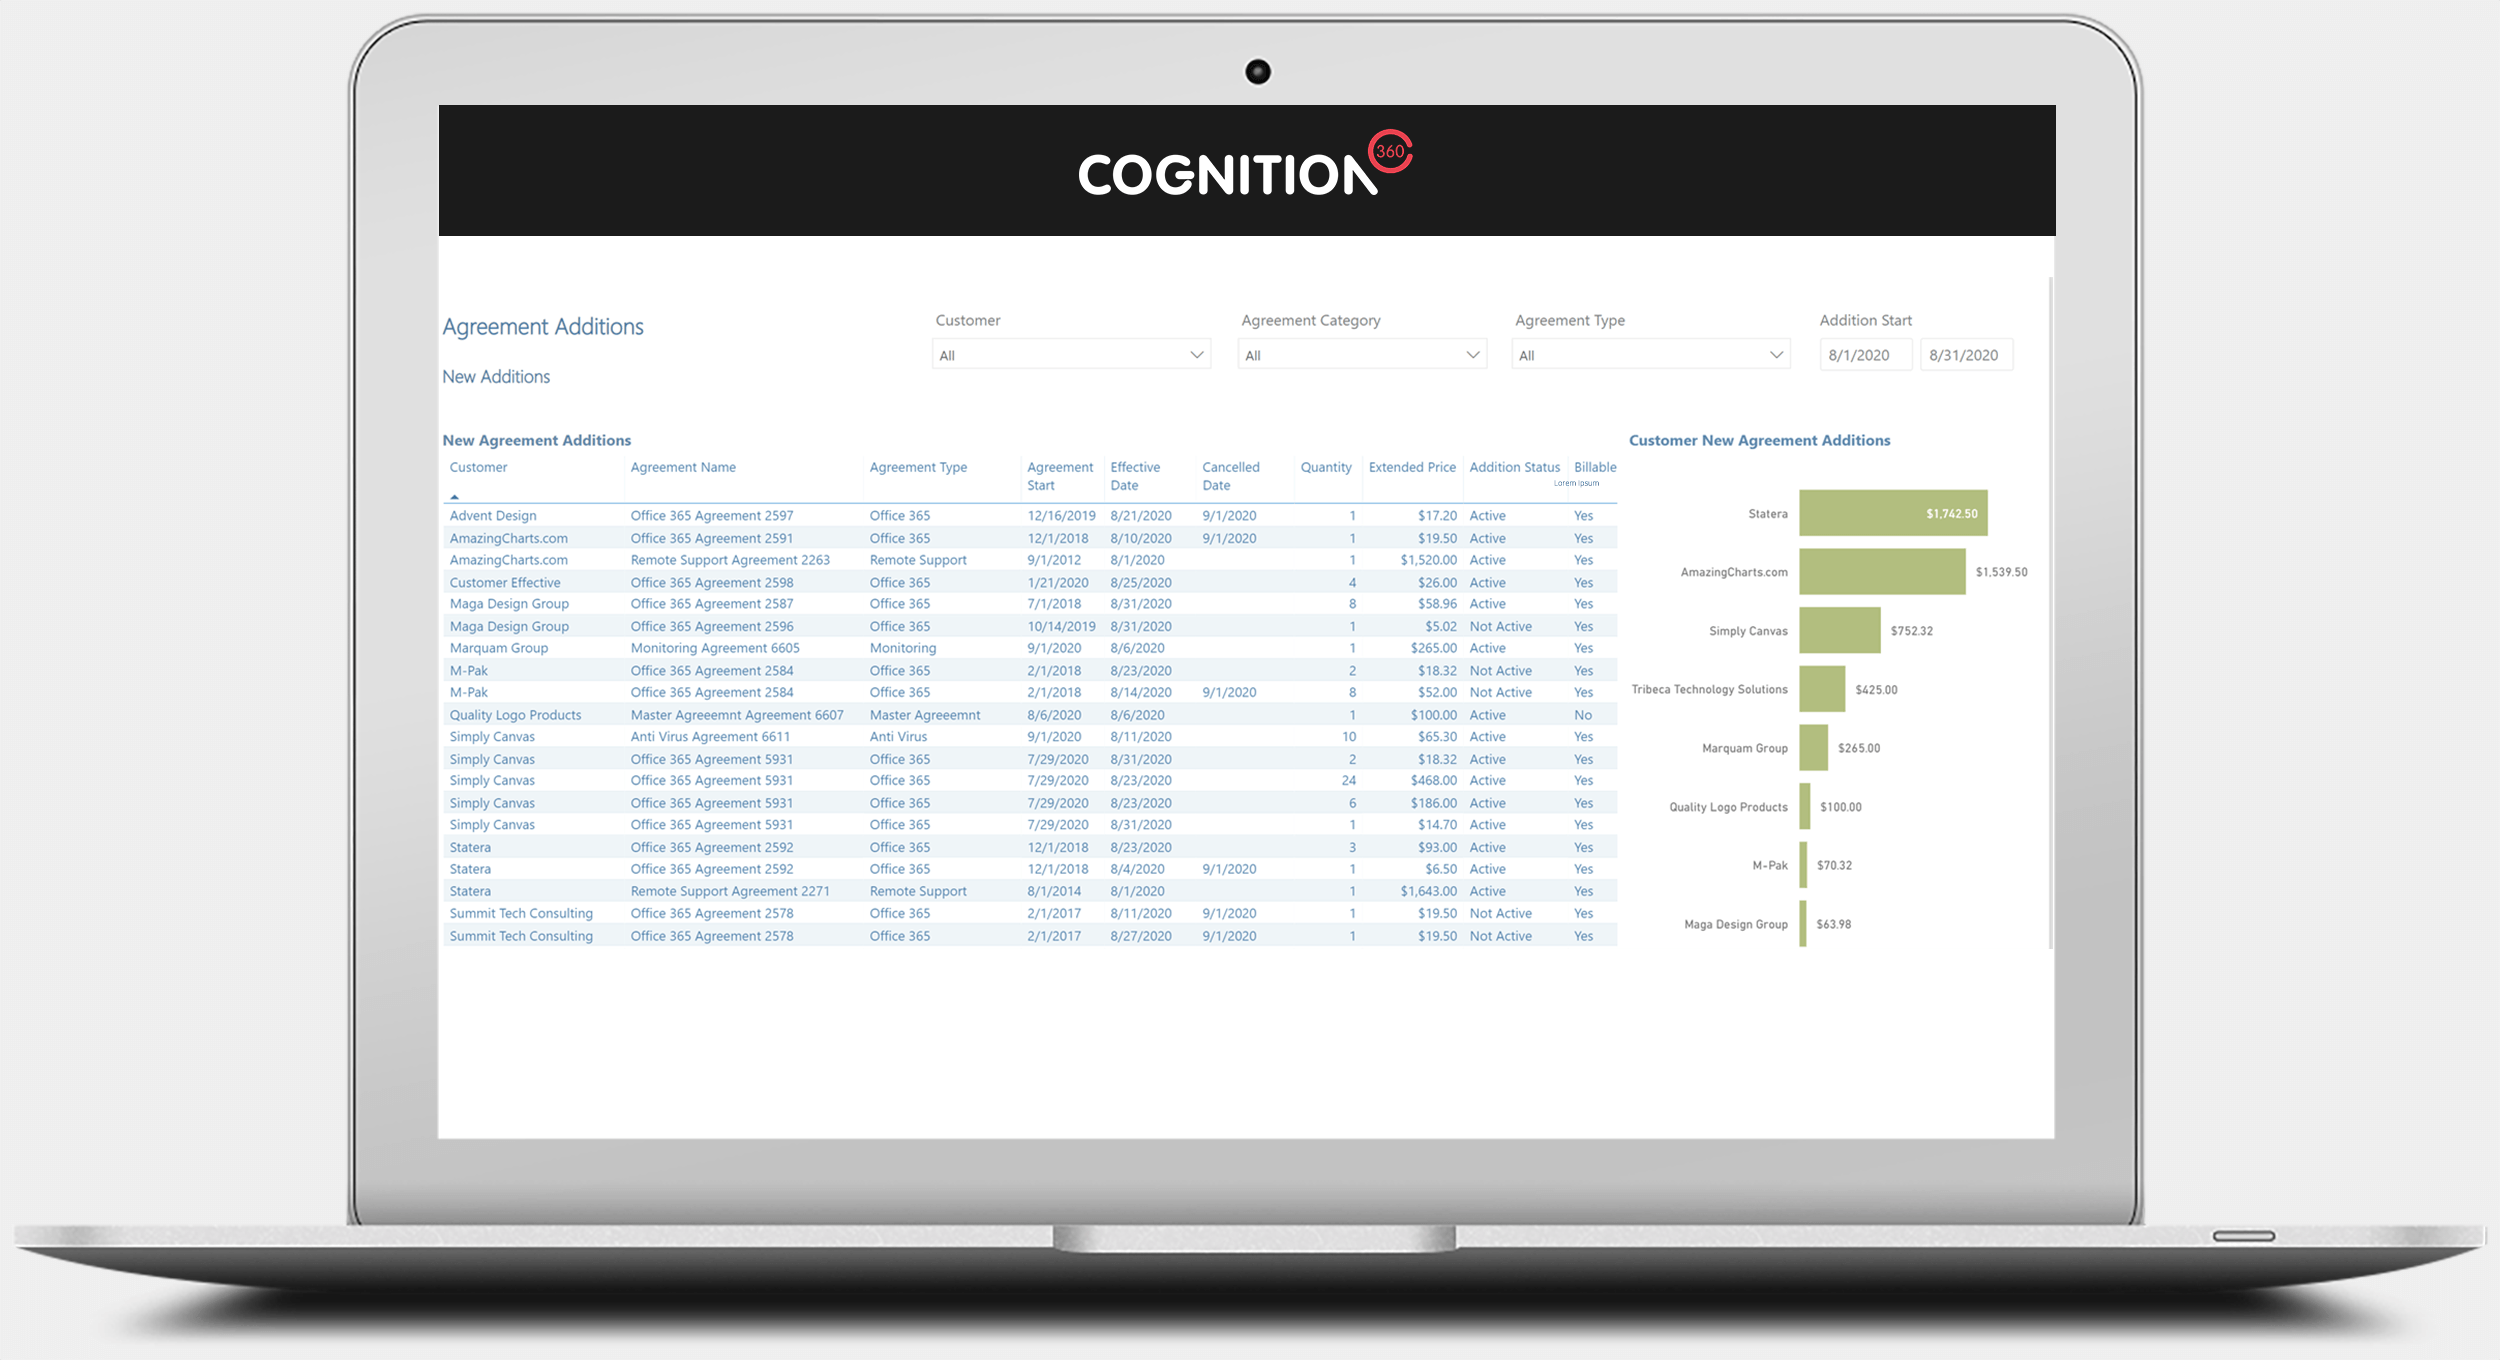
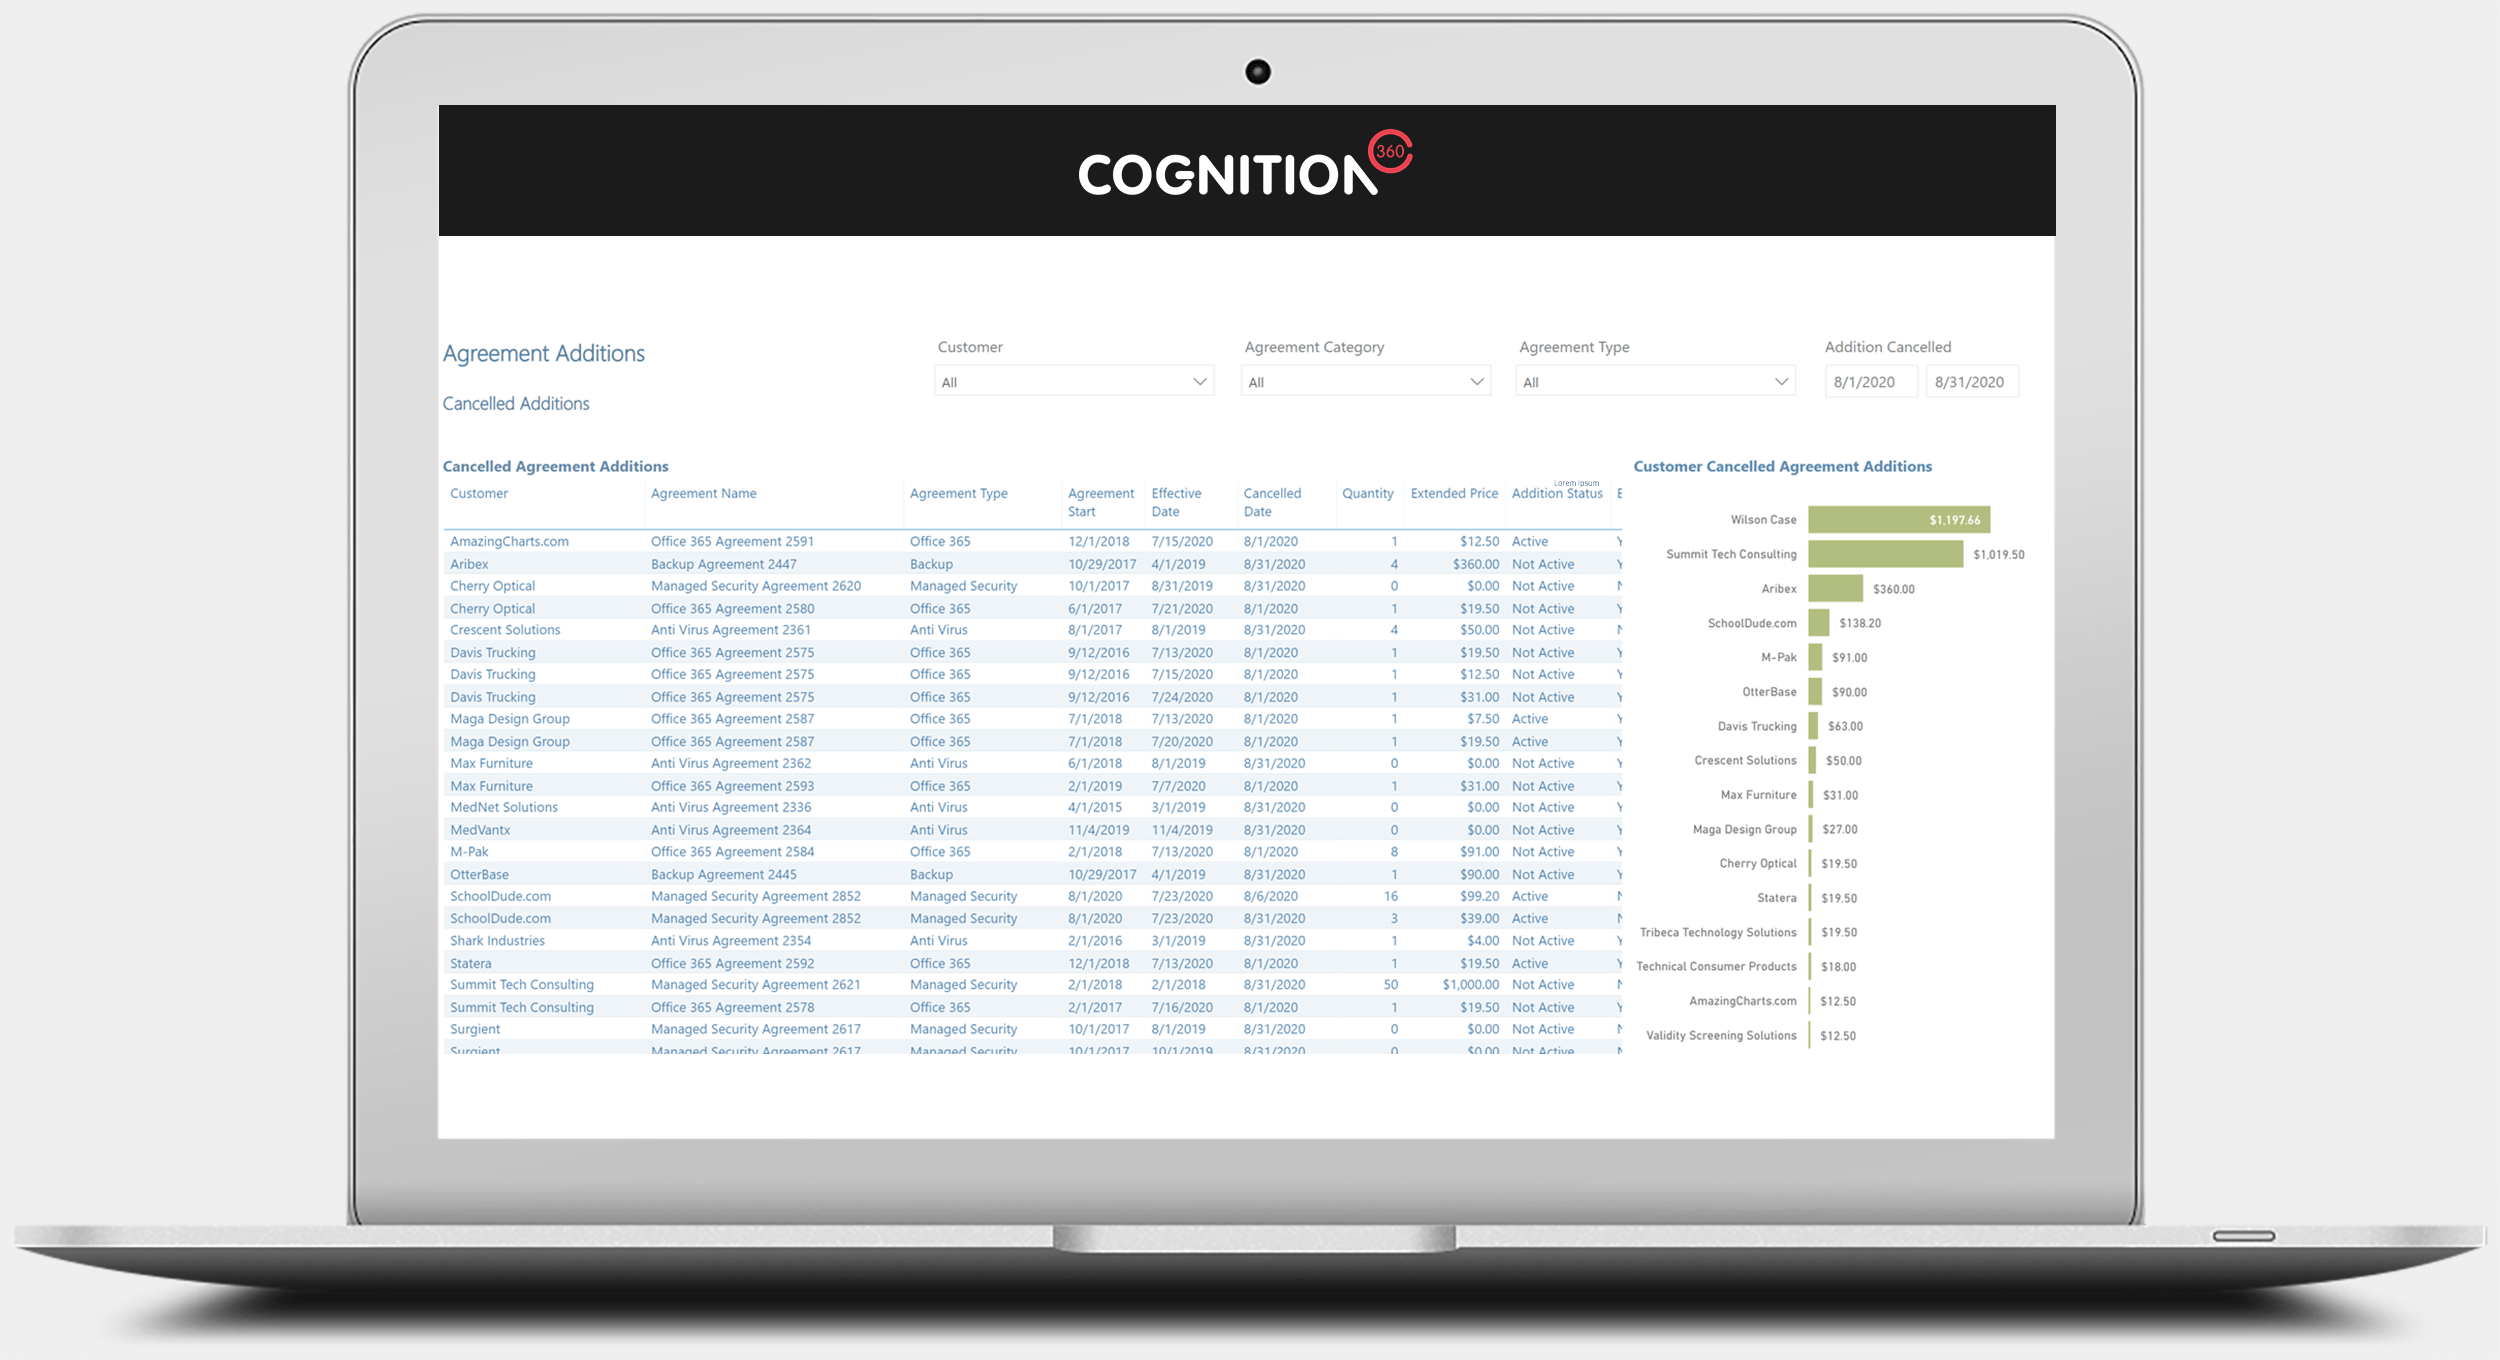
Agreement Additions (New/Cancelled) Report
View new and cancelled agreement additions for a selected period
The Agreement Additions (New/Cancelled) report can be used in conjunction with the Agreement Invoice Comparison report to understand the differences in billing to previous invoices.
Data can be used to assess if correct changes have been made to an agreement and that changes are applied for the correct periods. (Number of report views shown: 2)
Image too small? See full size images: View A (New Additions); View B (Cancelled Additions)
AUGUST 2020
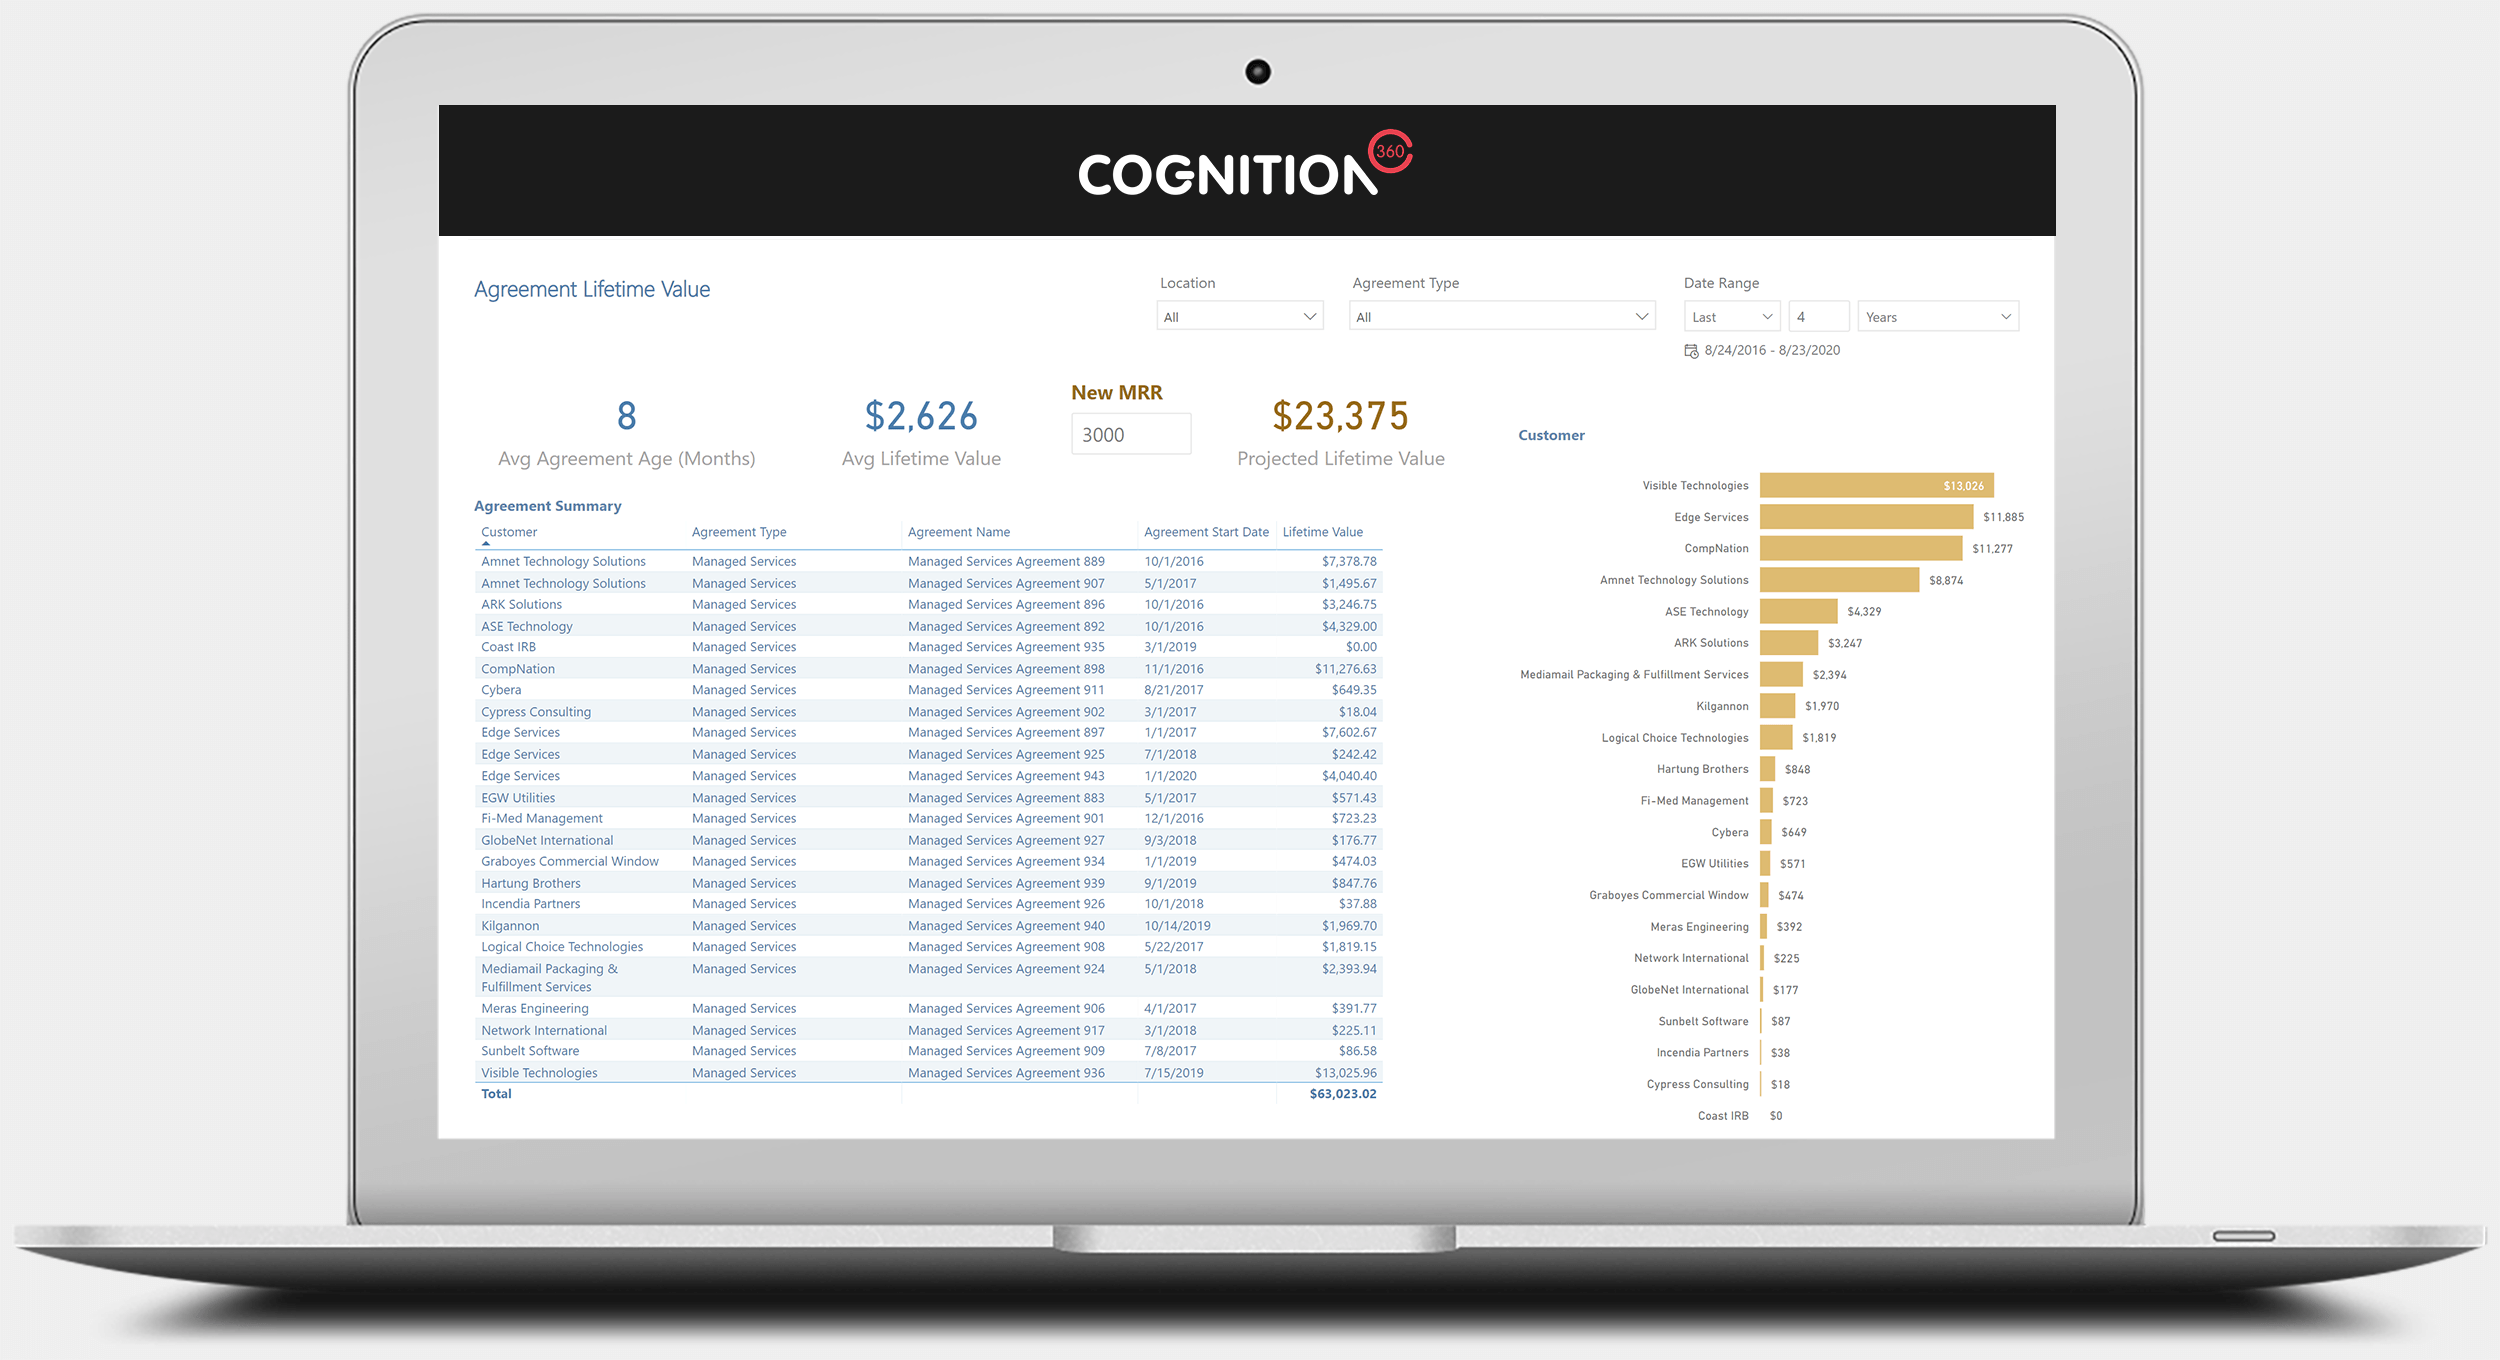
Agreement Lifetime Value Report
Analyze Agreement Lifetime Revenue for Organization and Customers
The Agreement Lifetime Value report lets you analyze the lifetime revenue for agreements for your organization and each customer. View the average agreement lifetime value and age across difference Agreement Types. Use the forecast option to enter new monthly recurring revenue and obtain the projected lifetime value of that agreement. (Number of report views shown: 1)
Image too small? See full size image
Ticket Labor Analysis Report
View Ticket & Labor Data
The Ticket Labor Analysis report allows you to view ticket and labor data across Customers, Boards and Common Issues (Ticket Type and Subtype).
See which Boards are recording the most labor hours. Then expand the data to view labor hours on the underlying Common Issues for the Boards. (Number of report views shown: 2)
Work Type Usage Report
See How Time is Recorded
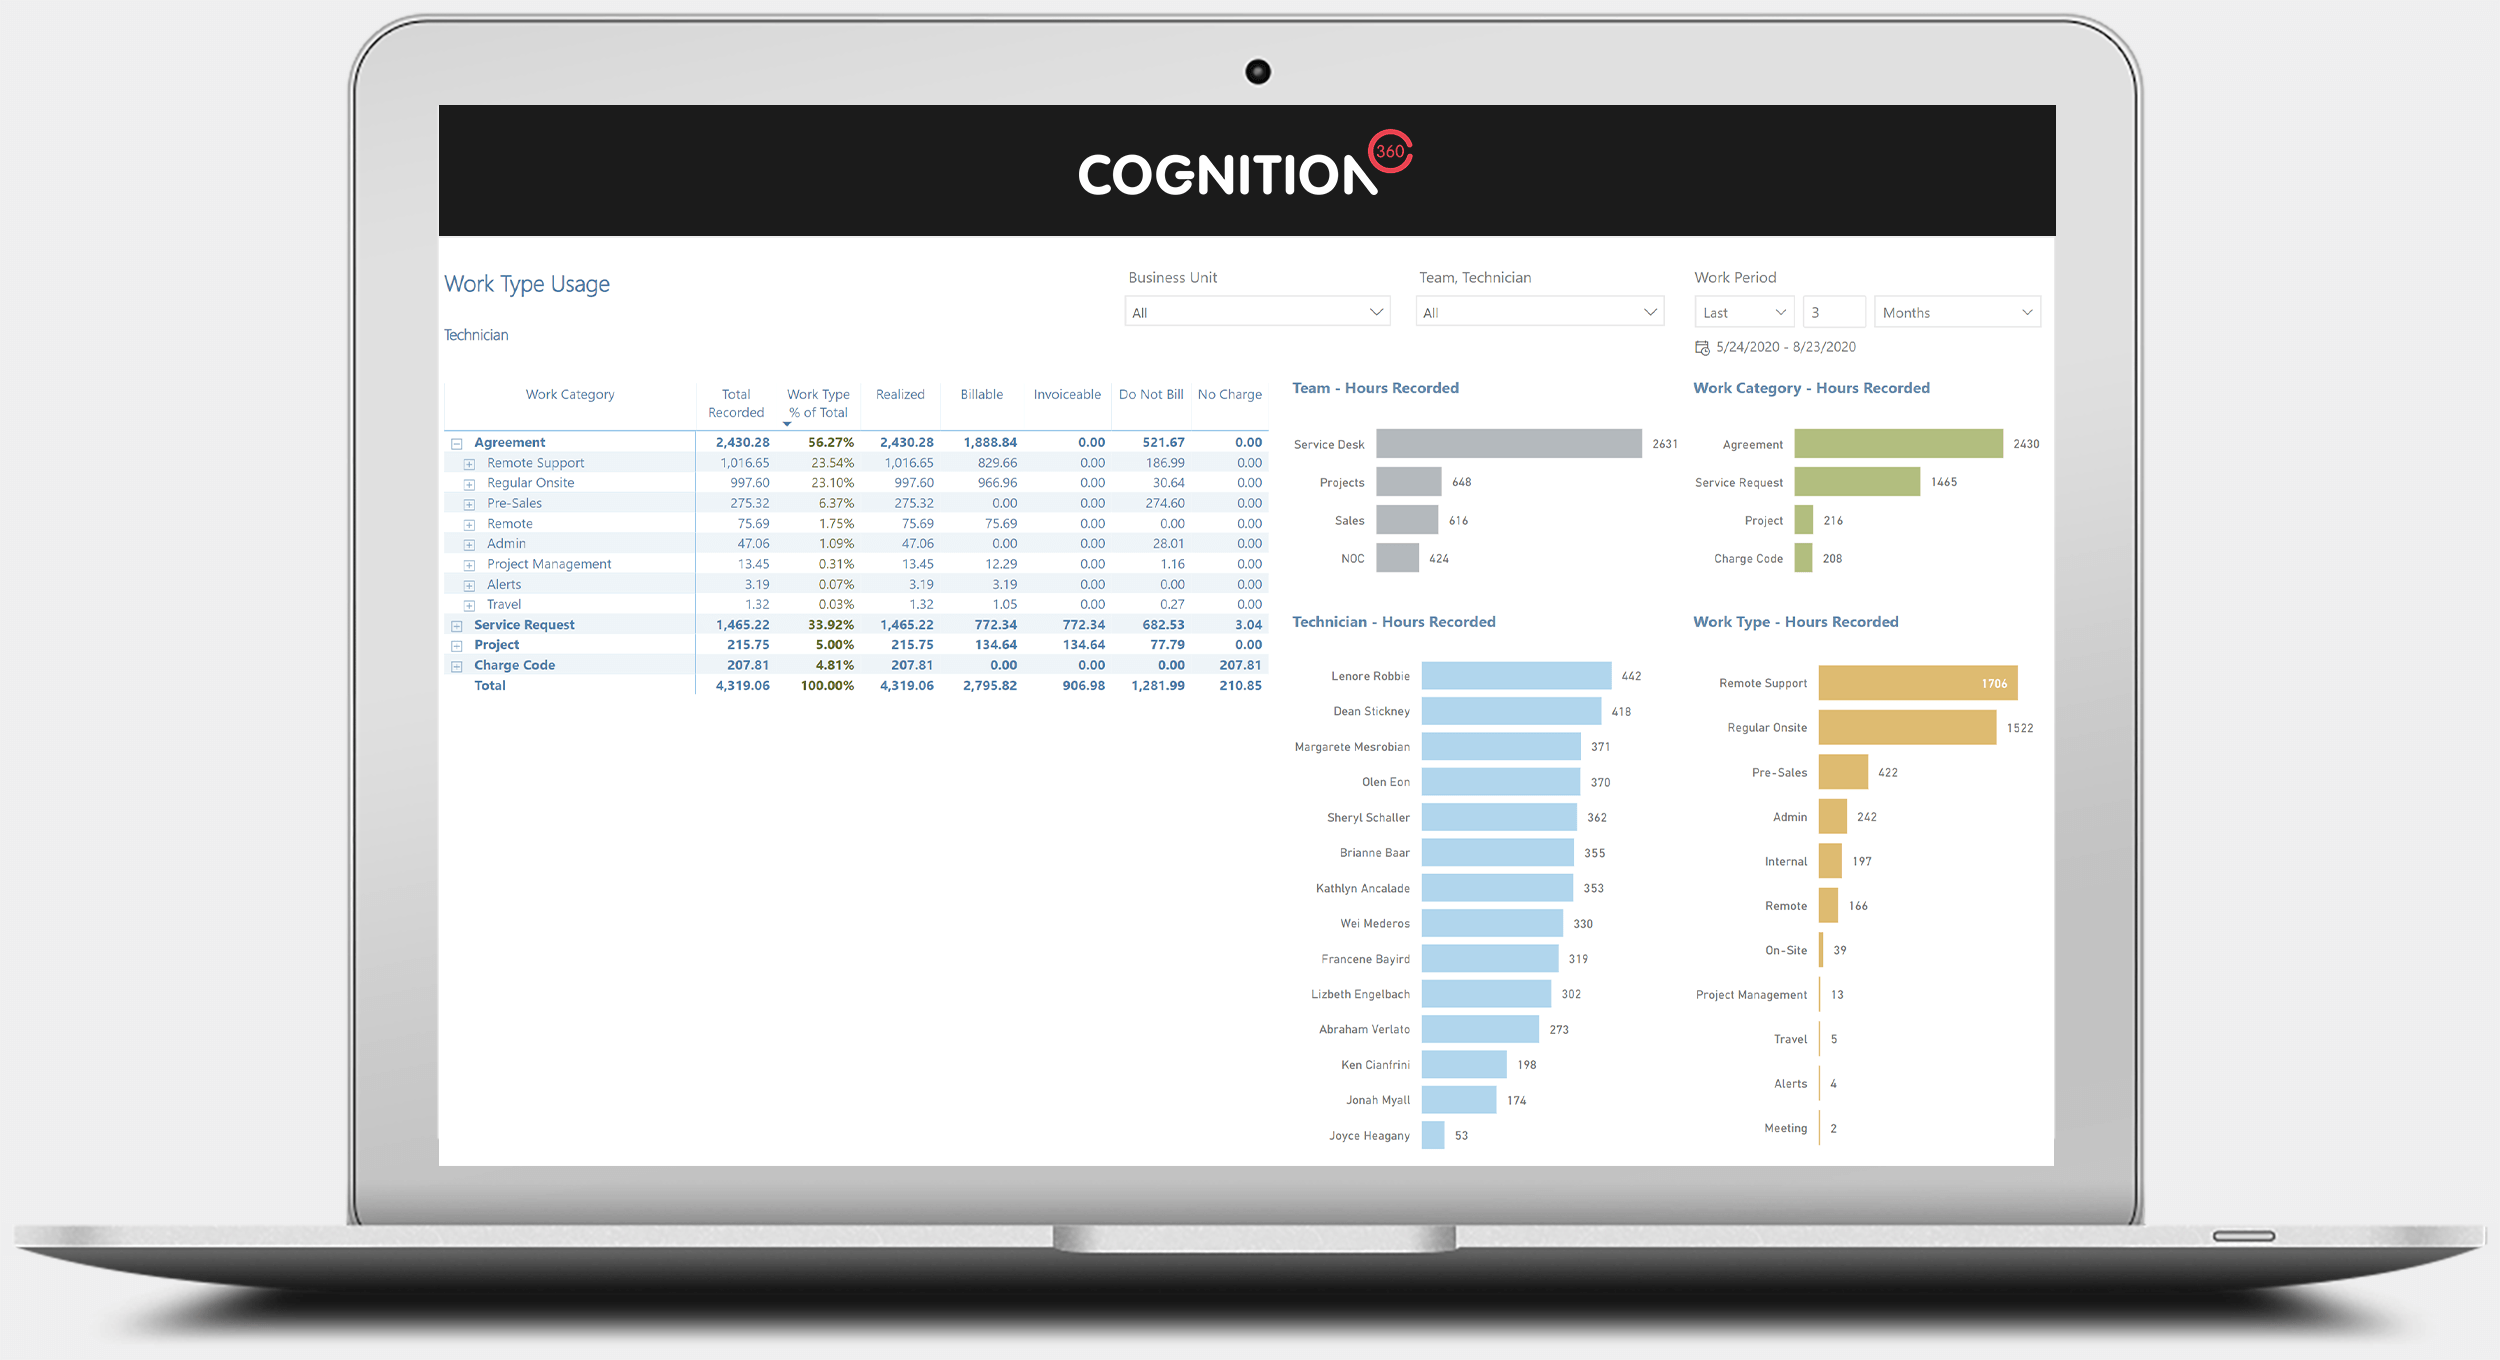
The Work Type Usage report lets you view how time is recorded in your organization. Quickly see the hours and percentages of recorded time split across Agreement, Project and Service (Time & Materials) tickets and Charge Codes.
Expand the data to view the Work Type splits within the work category. (Number of report views shown: 1 )
Image too small? See full size image
MAY 2020
Labor Work Type Costs Report Views
Analyze and Proactively Manage Labor Work Type Costs
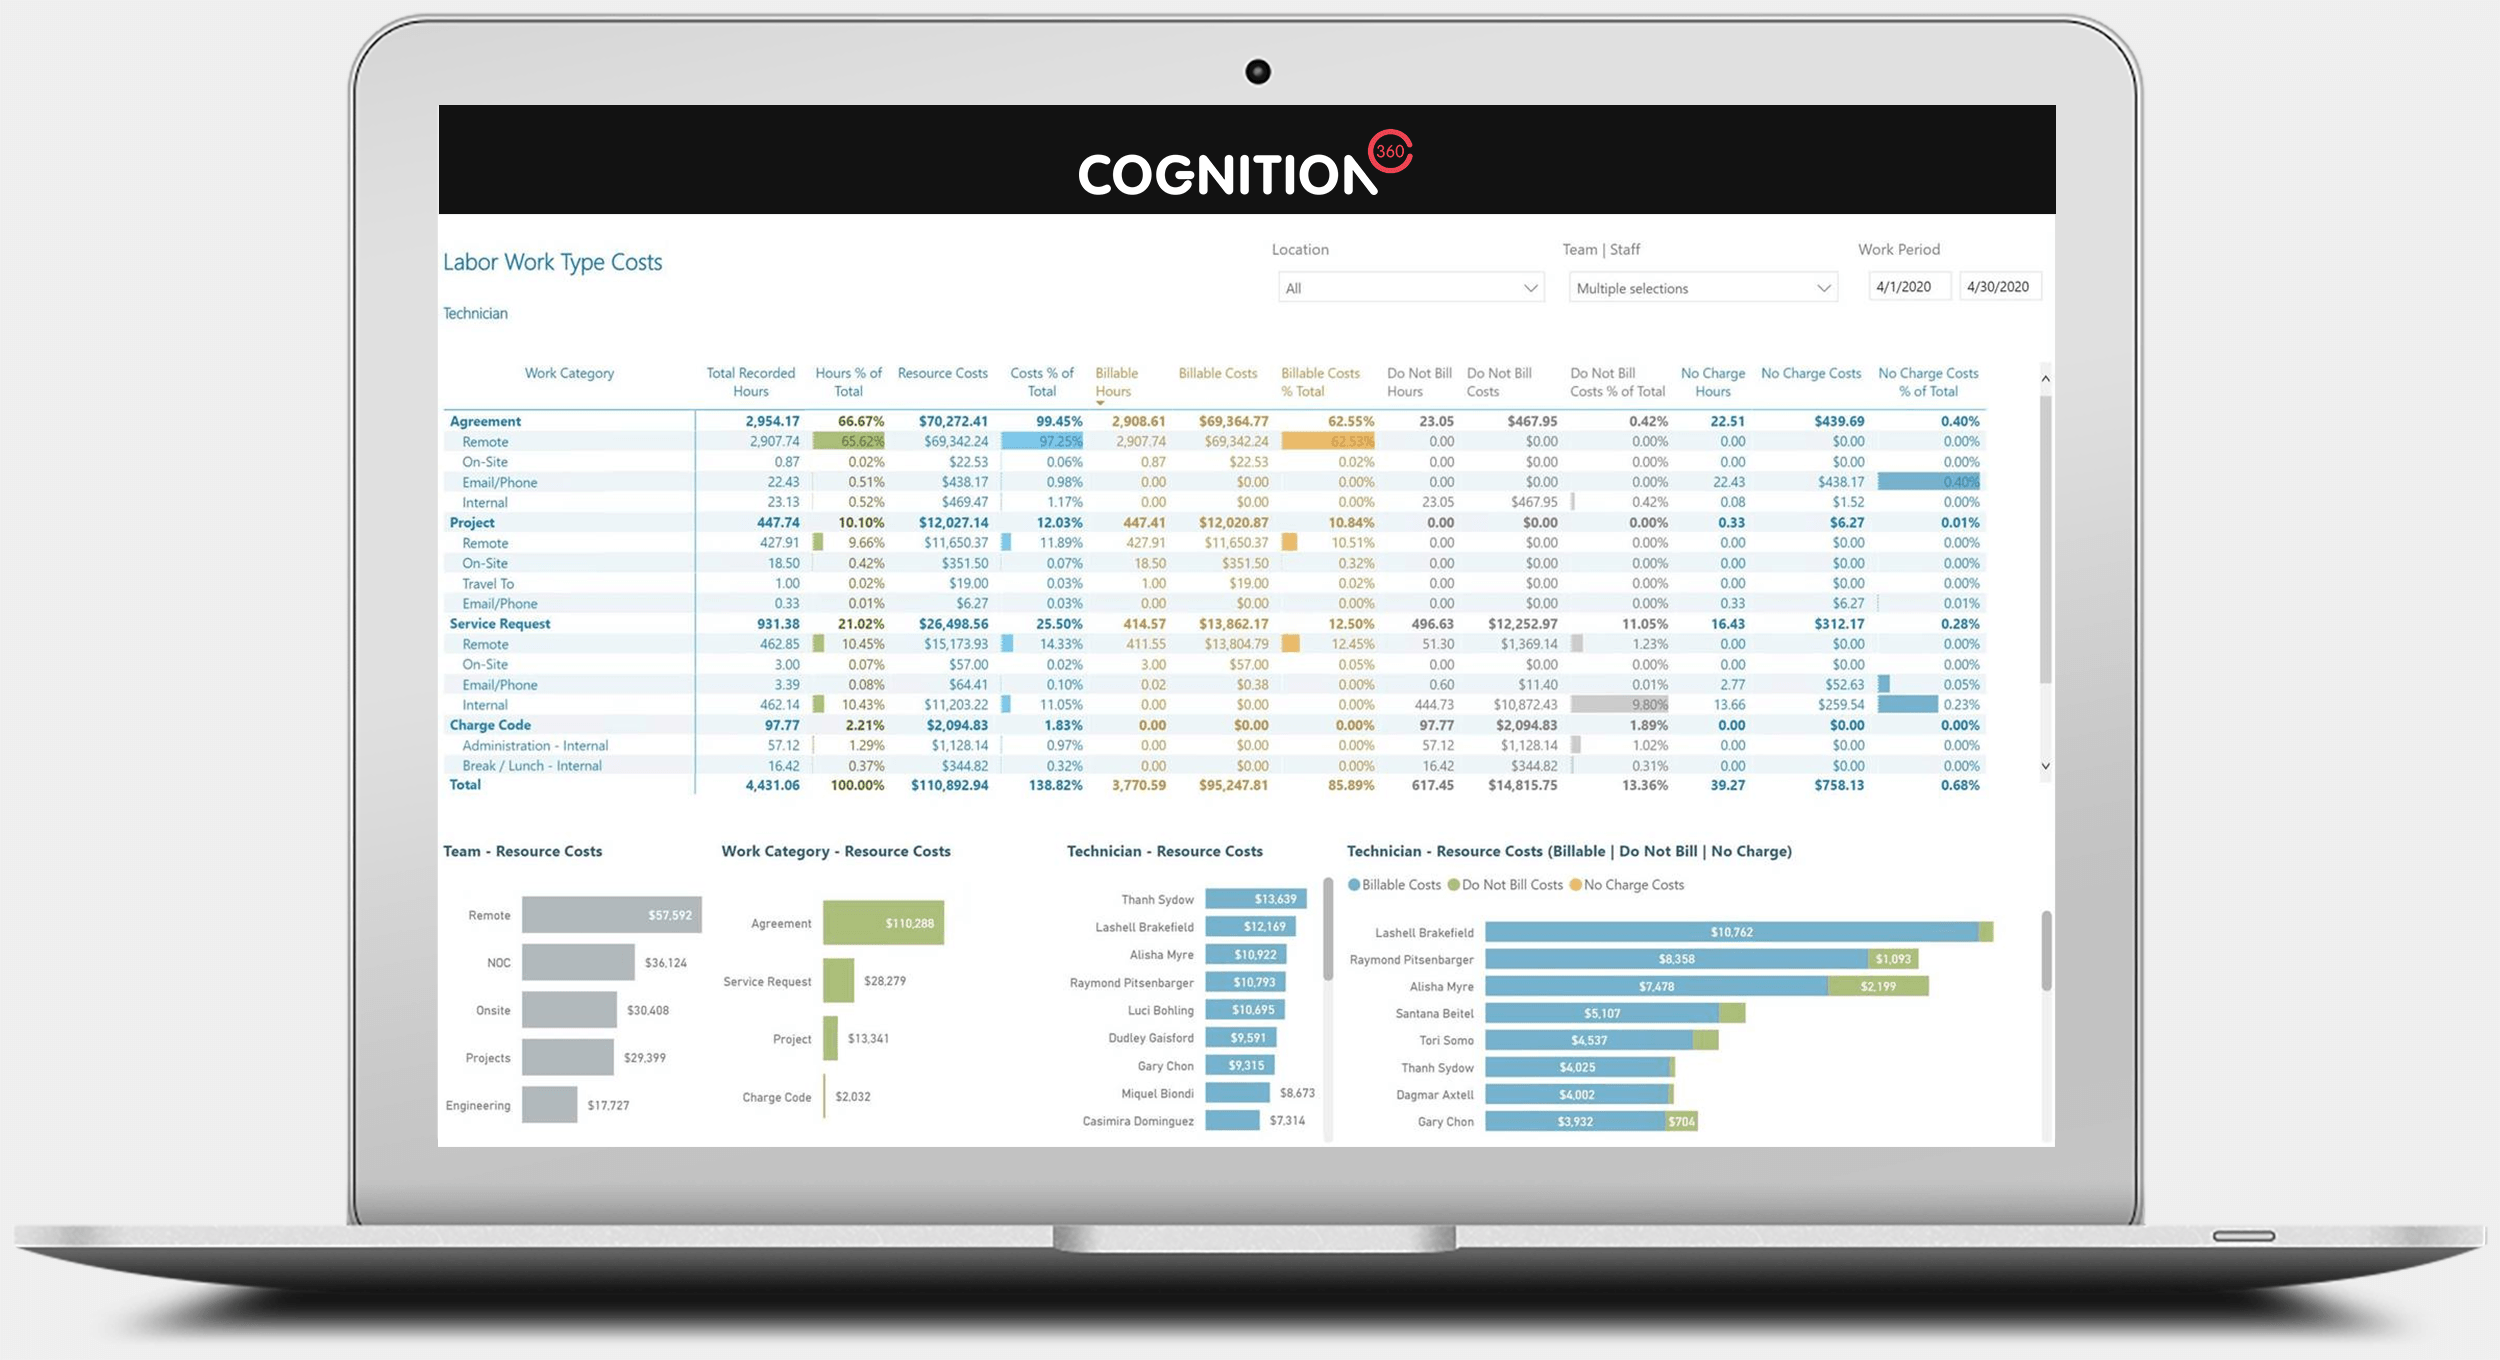
The Labor Work Type Costs report lets you see where your resource costs splits are a) by work category and work type and b) by labor billing state. The report can assist you in locating areas to reduce costs and potentially move the resource costs to a customer billable item.
In addition, the report can be viewed from a customer perspective. This allows the user to see the resource costs for the recorded labor on a customer. (Number of report views shown: 1)
Image too small? See full size image
Customer Project Summary Report View
No Surprises: Customer Project Summary Reporting and Tracking
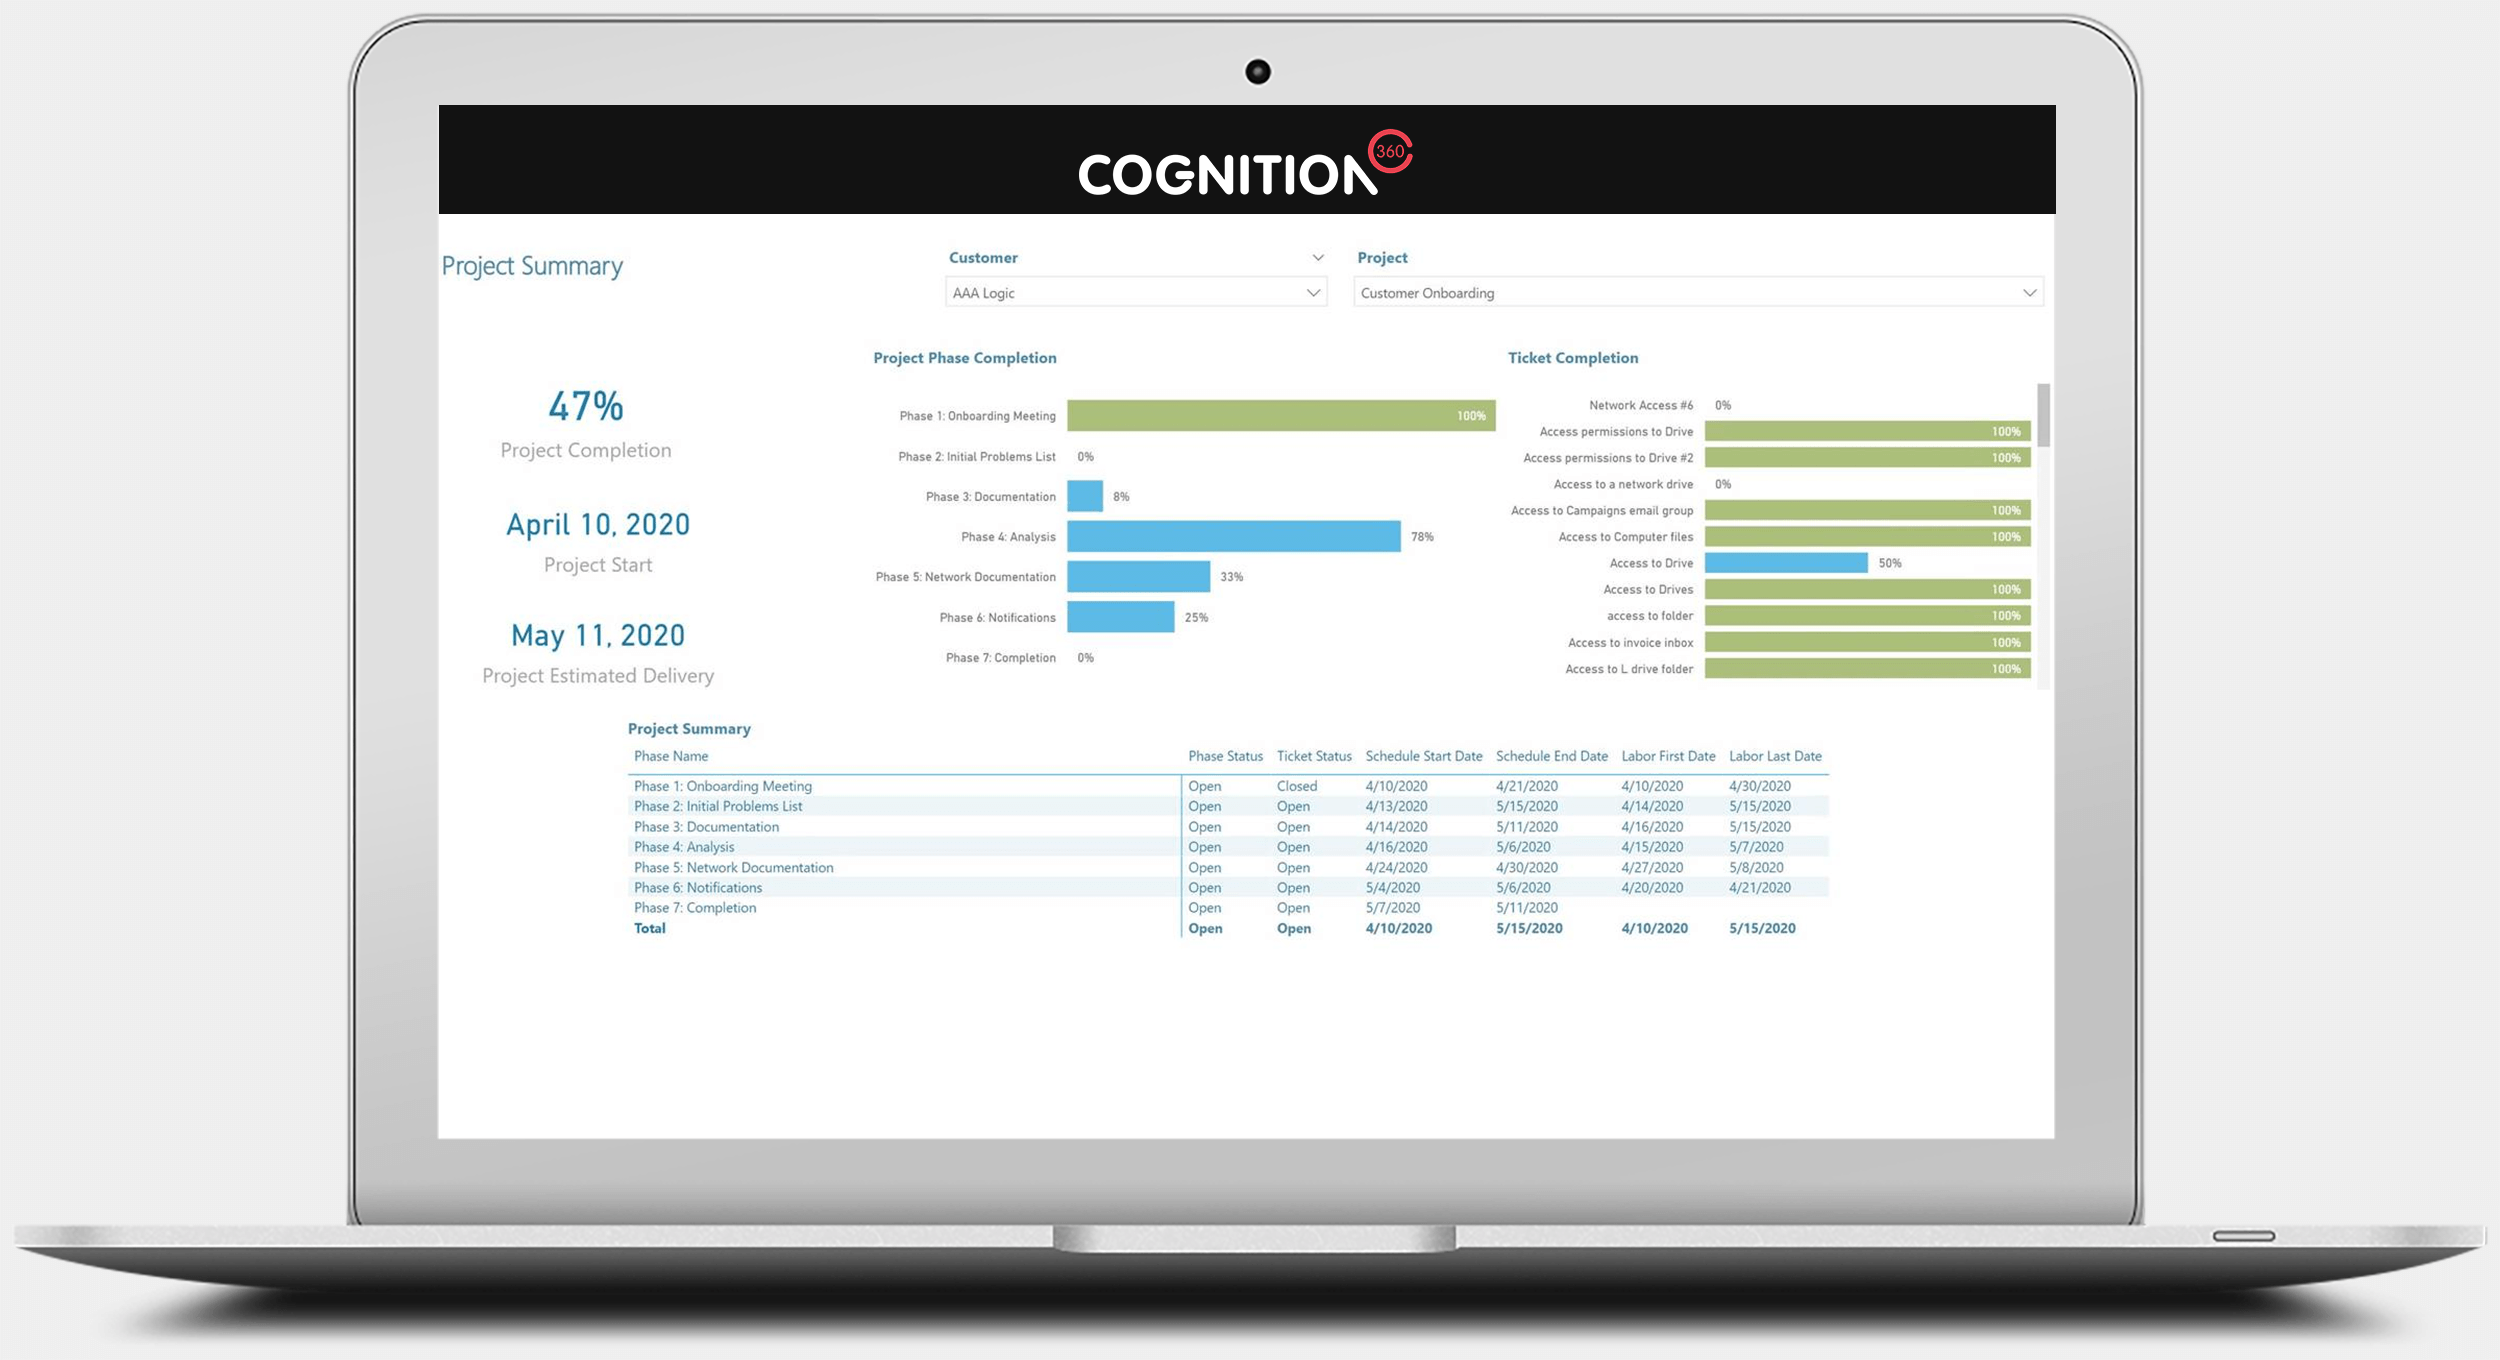
The Customer Project Summary report has all the data you need to show the customer the progress of a Project. Track completion rate in terms of Phases and Tickets completed. Review project phase and tickets for scheduled labor and labor activity. Drill down on phases to see associated ticket details. (Number of report views shown: 1)
Image too small? See full size image
Customer Interactions Report Views
Identify ‘Flight Risk’ Customers Reducing Their Use of MSP Services
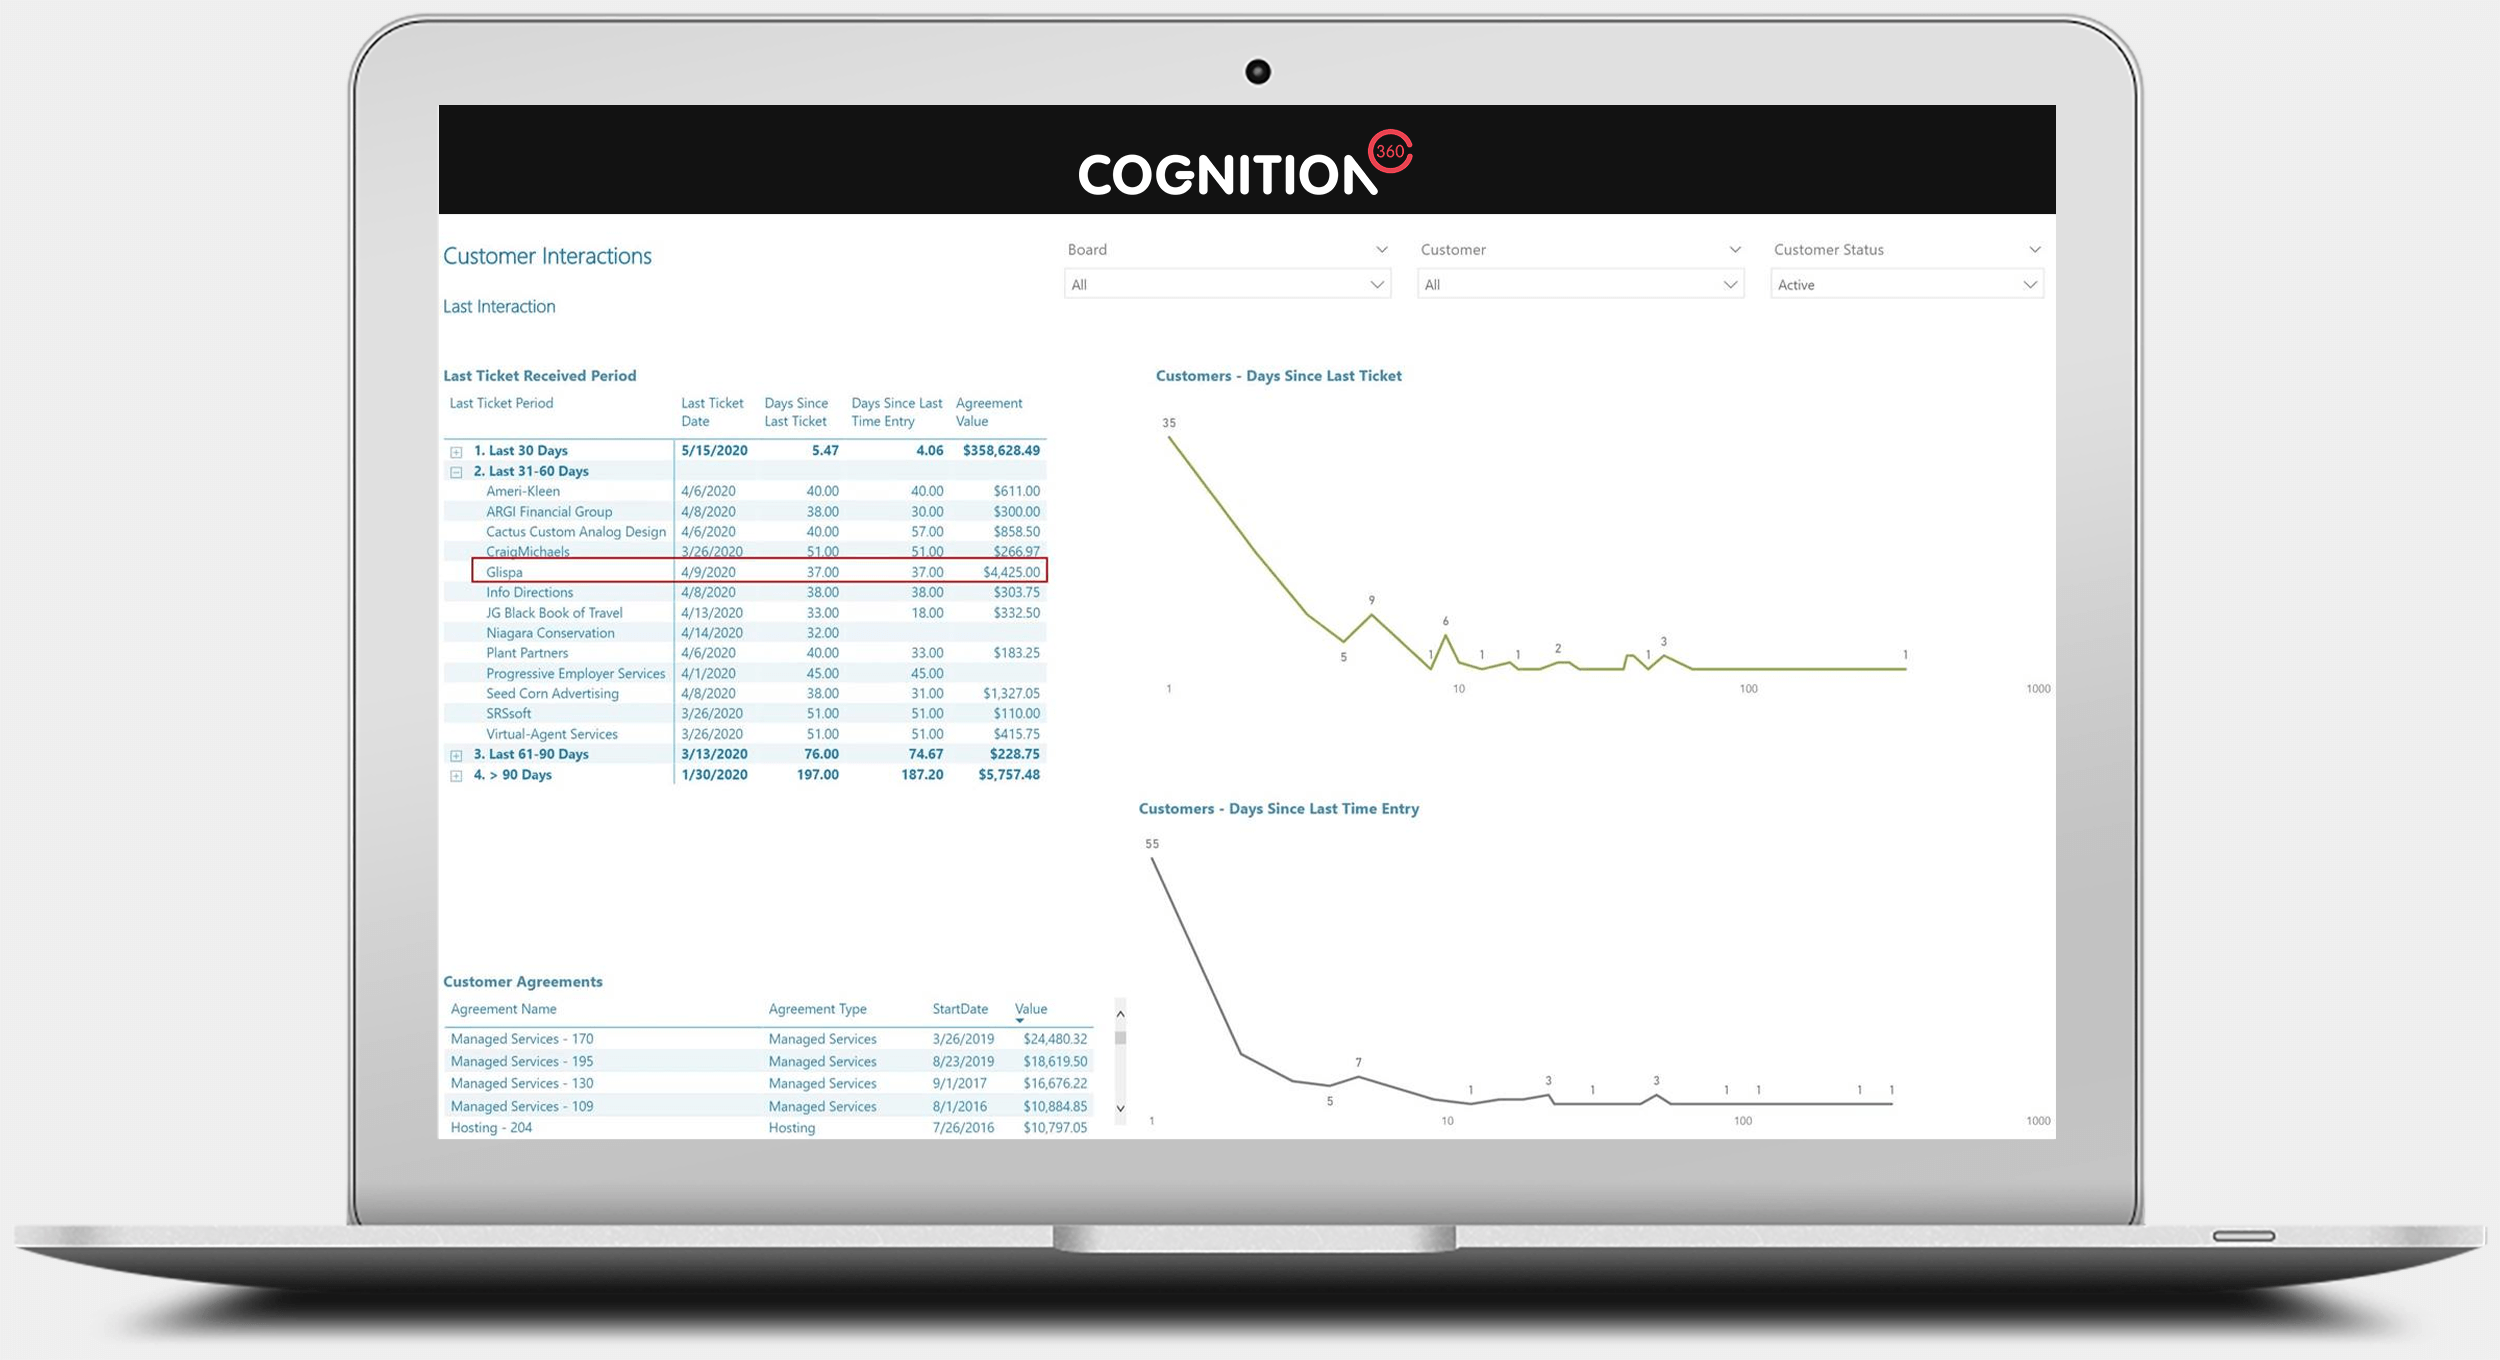
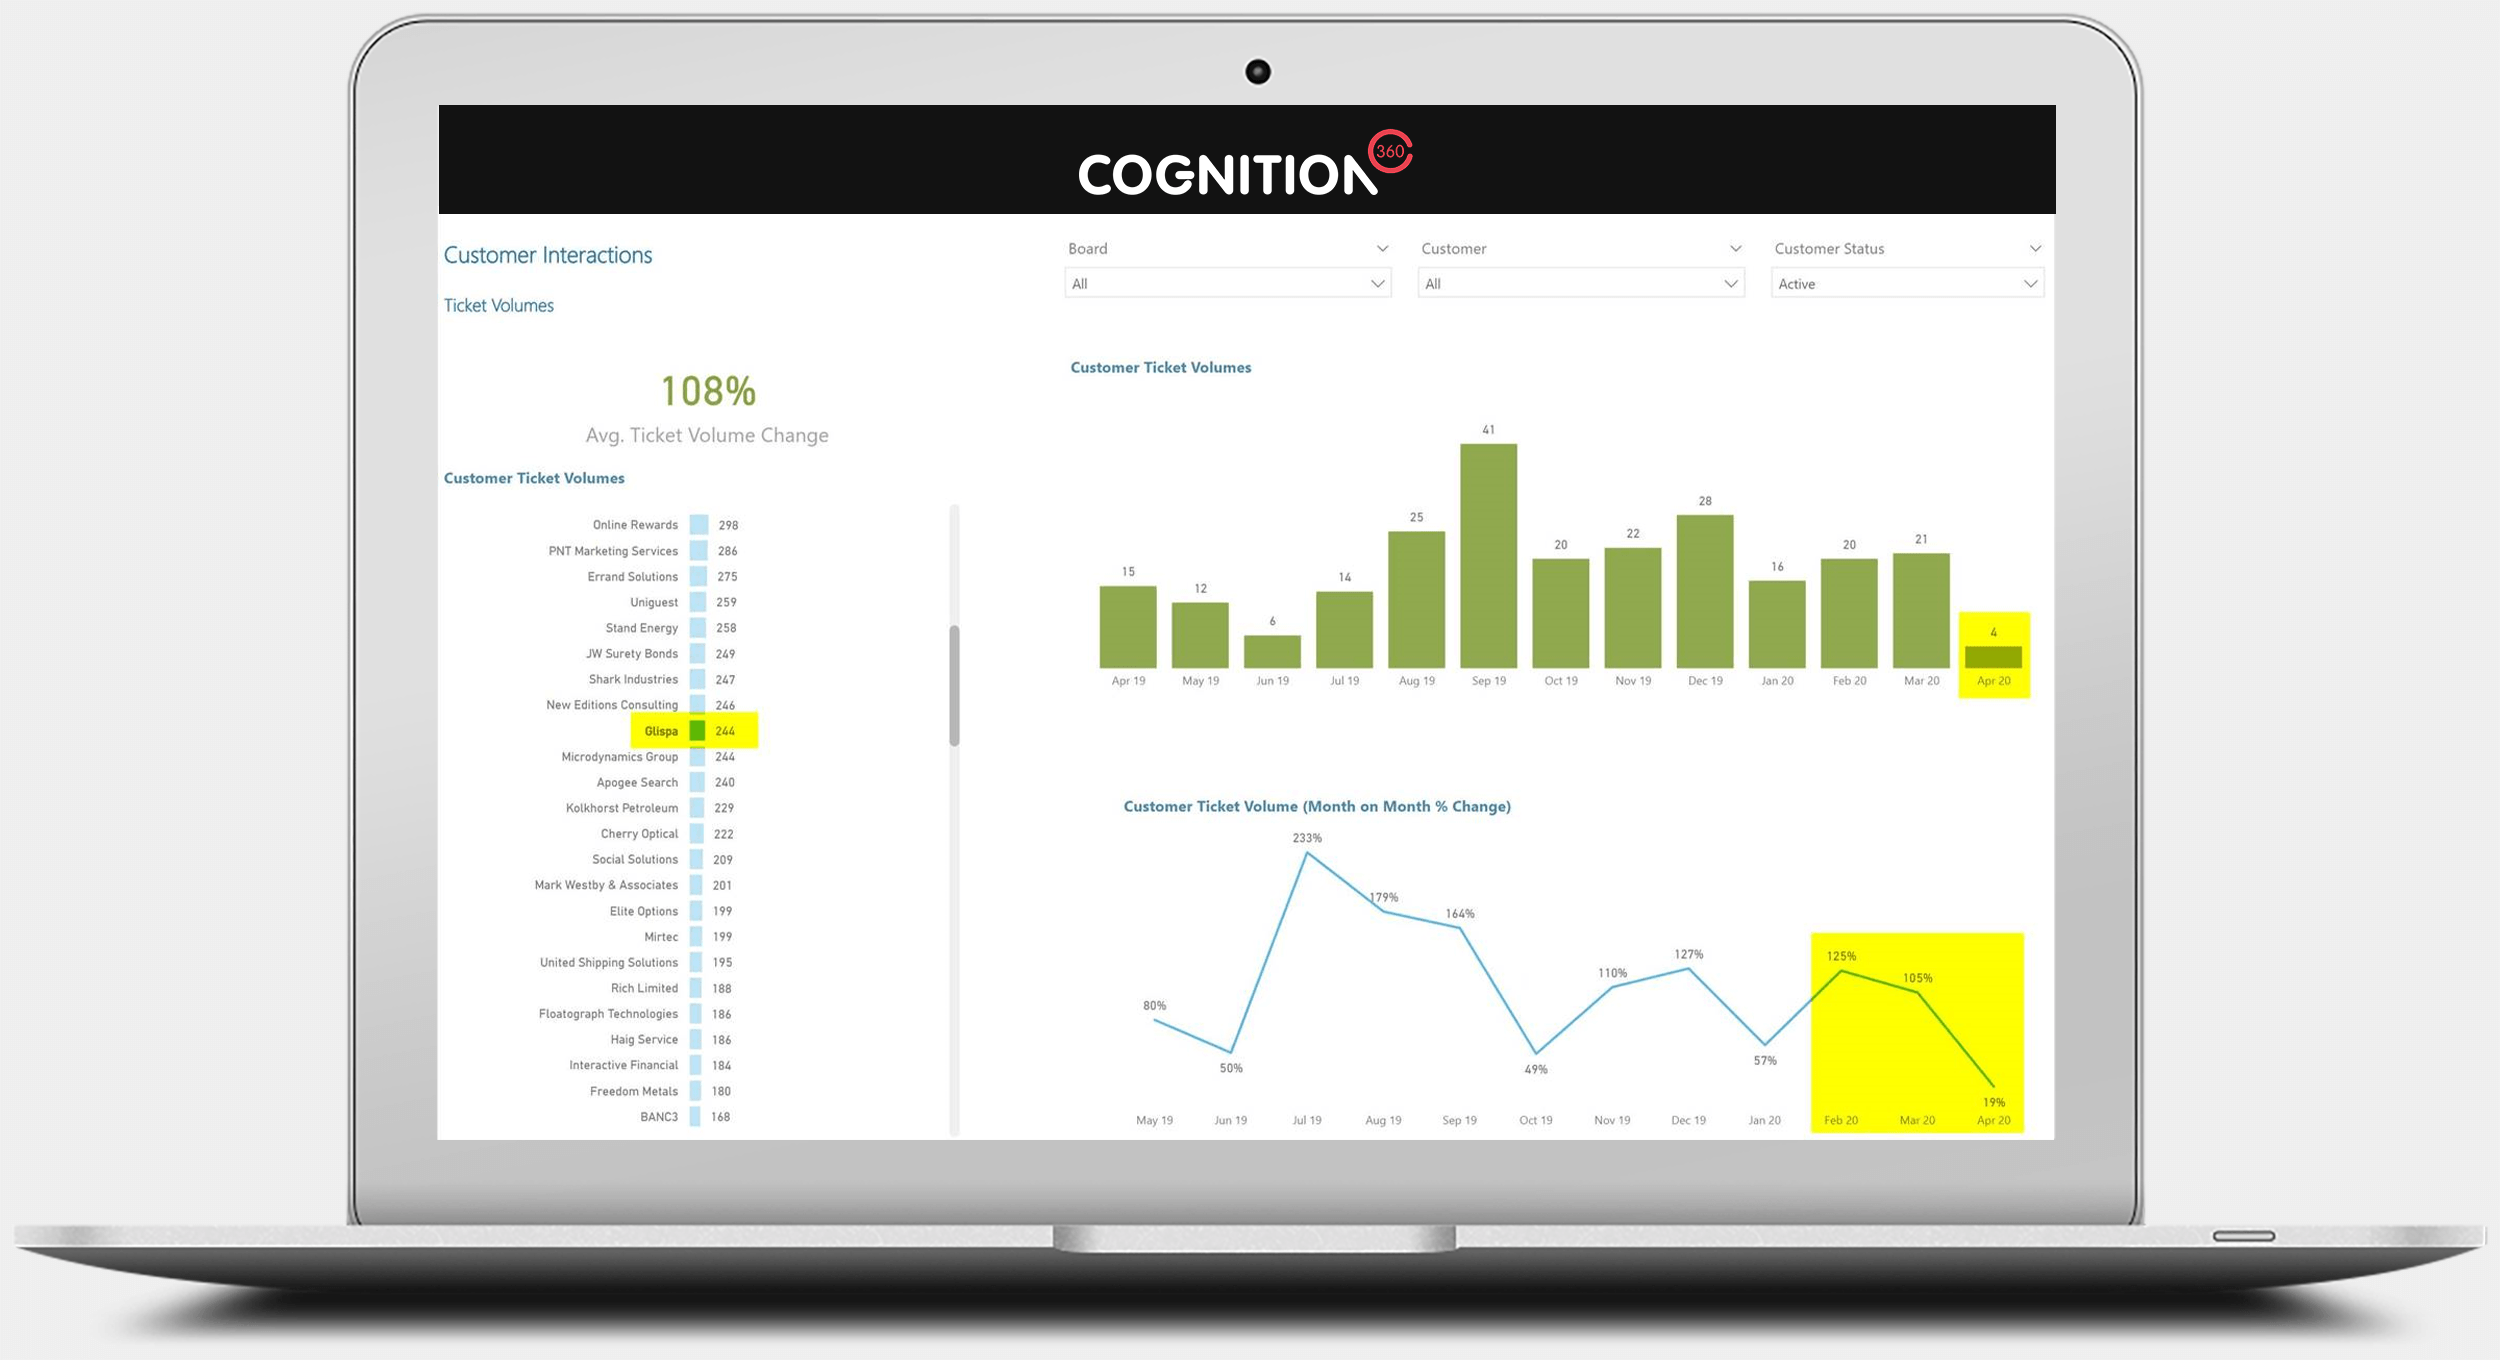
In the Customer Interactions report views, you can see which customers have not opened a new ticket by time period, and could therefore be a potential flight risk. Assess the customers reducing their service items by MRR value to allow you to identify which customers to focus on first. (Number of report views shown: 2 )
- The first report view (A) highlights customer ‘Glispa’. Their last ticket was logged on April 9th, 37 days ago. They have an active Agreement (MRR) value of $4.4K.
- The second report view (B) shows the historical ticket volumes and month-on-month ticket volume changes. Glispa have open four tickets in April and none in May. This could indicate that Glispa are a flight risk with an MRR of $4.4K.
Agreement Invoice Comparison Report View
Agreement Invoice Comparison: Avoid Unnecessary Billing Queries from Customers
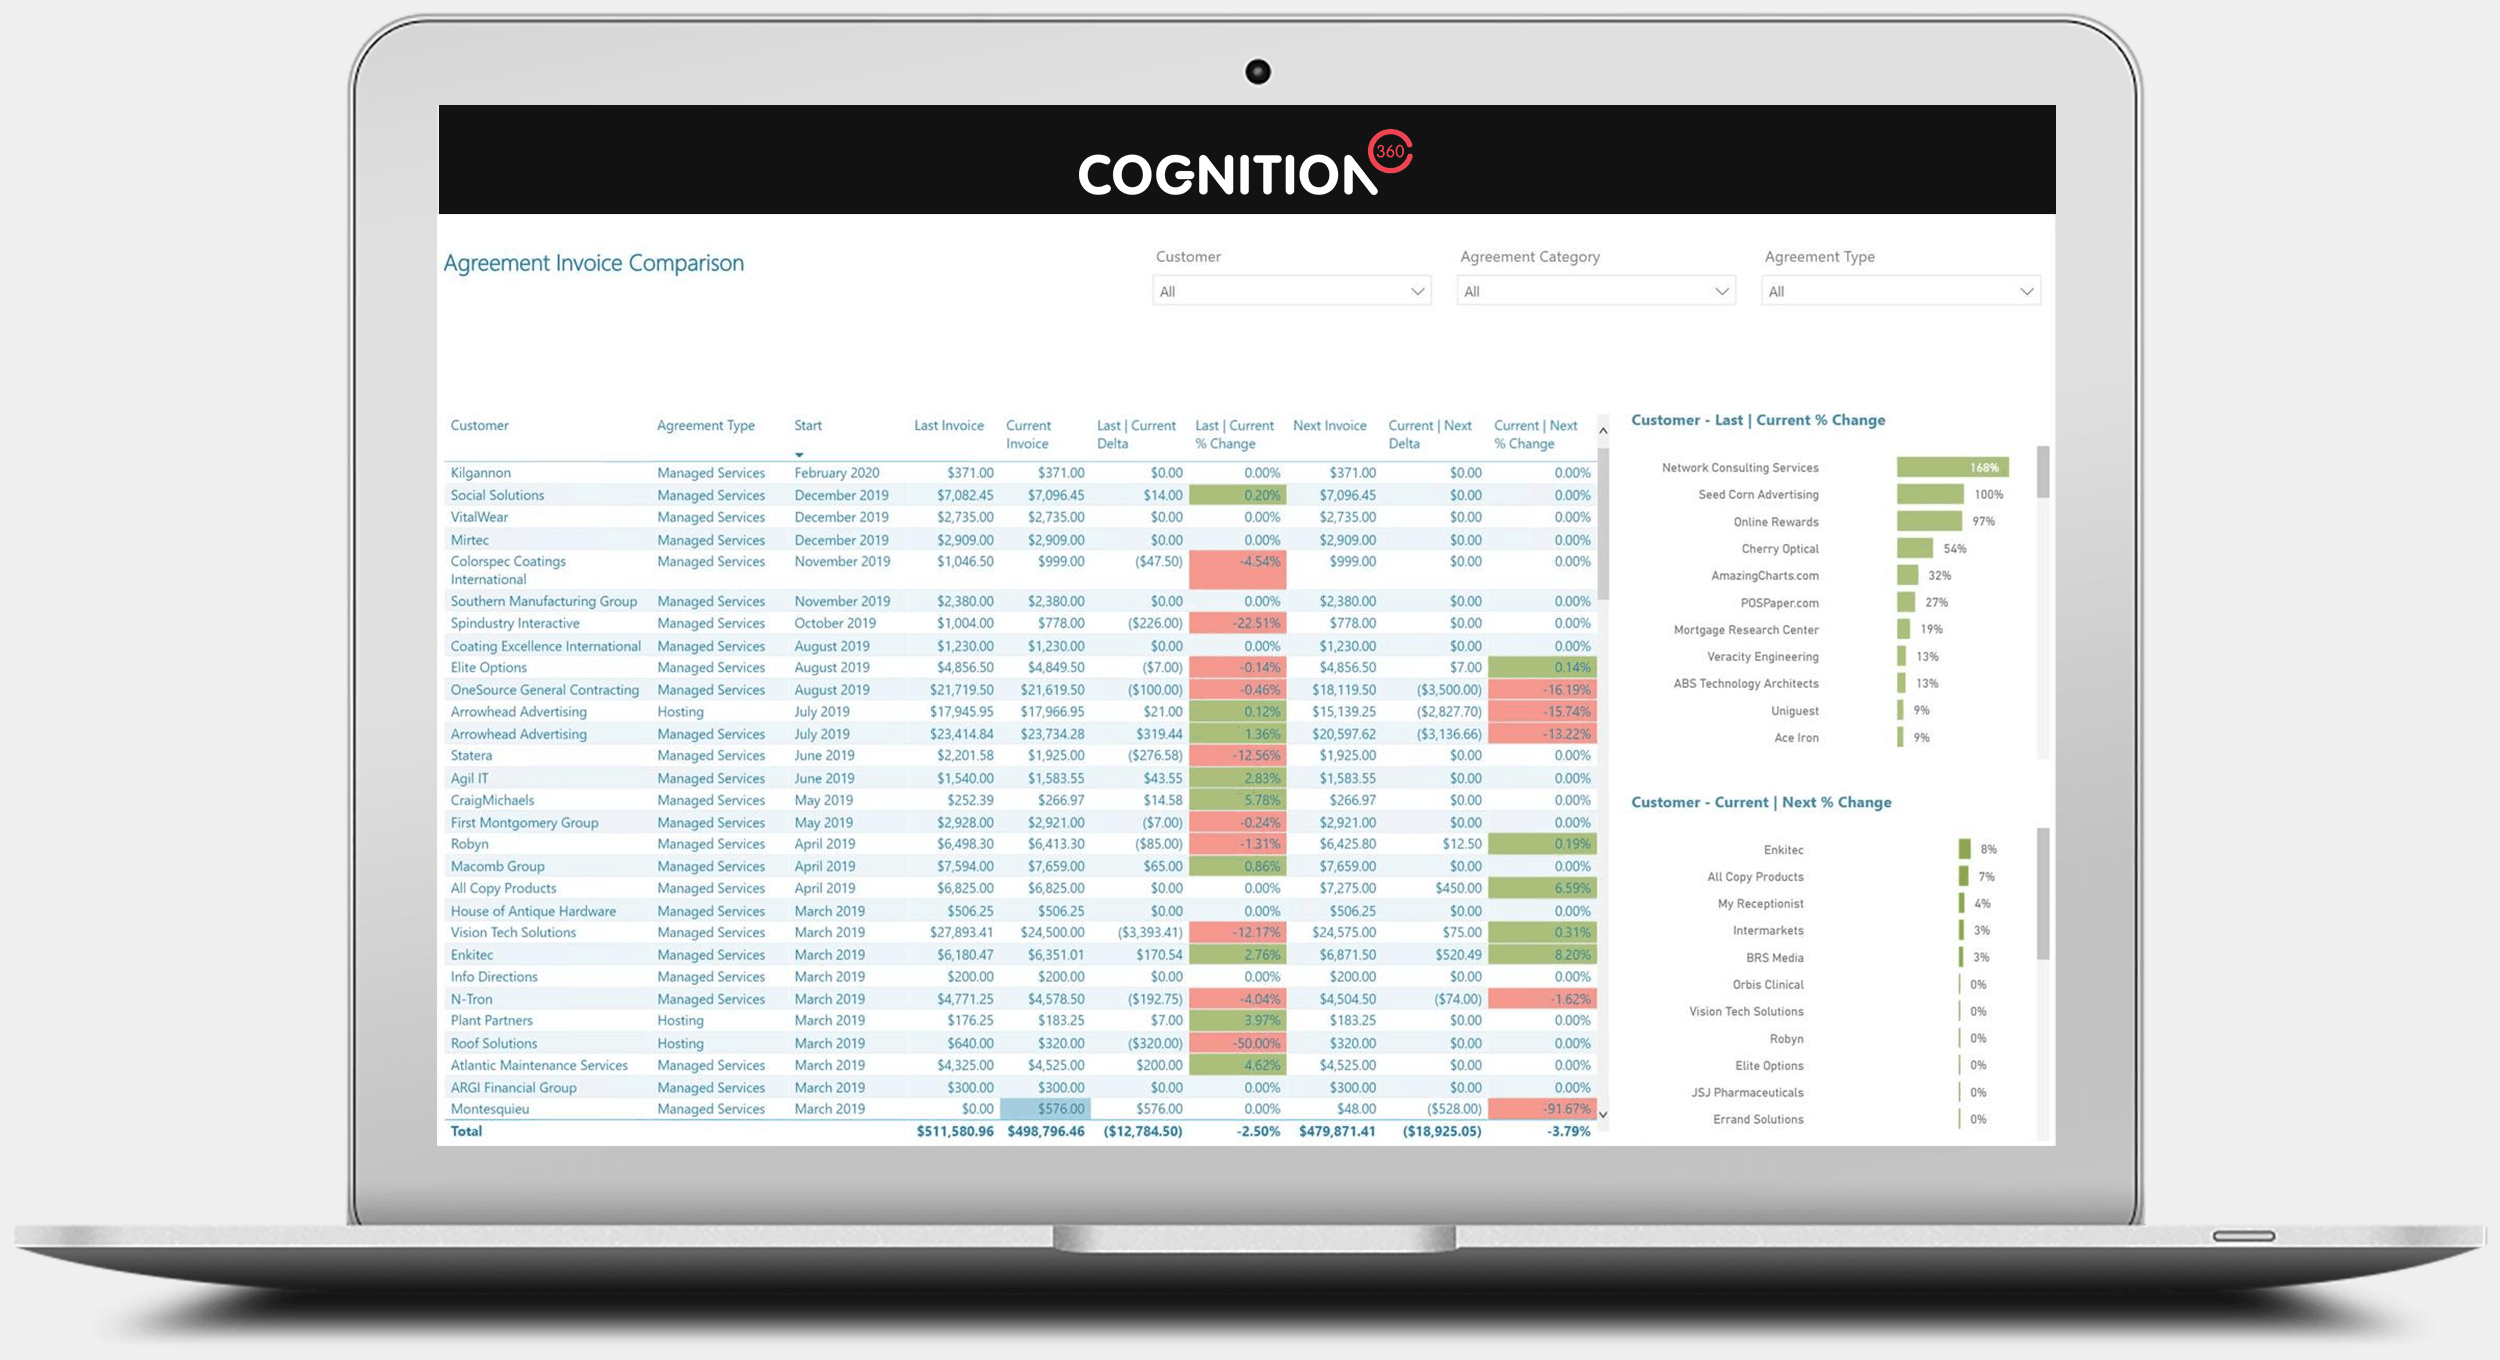
The Agreement Invoice Comparison report allows you to compare agreement invoices to see changes over the current and last invoice and also changes for the next invoice. Easily identify changes in invoicing that may or may not be expected. Capture and understand these changes before the invoices are generated and avoid unnecessary queries from customers for billing changes. (Number of report views shown: 1)
Image too small? See full size image
MARCH 2020
Ticket Quality Benchmark Report Views
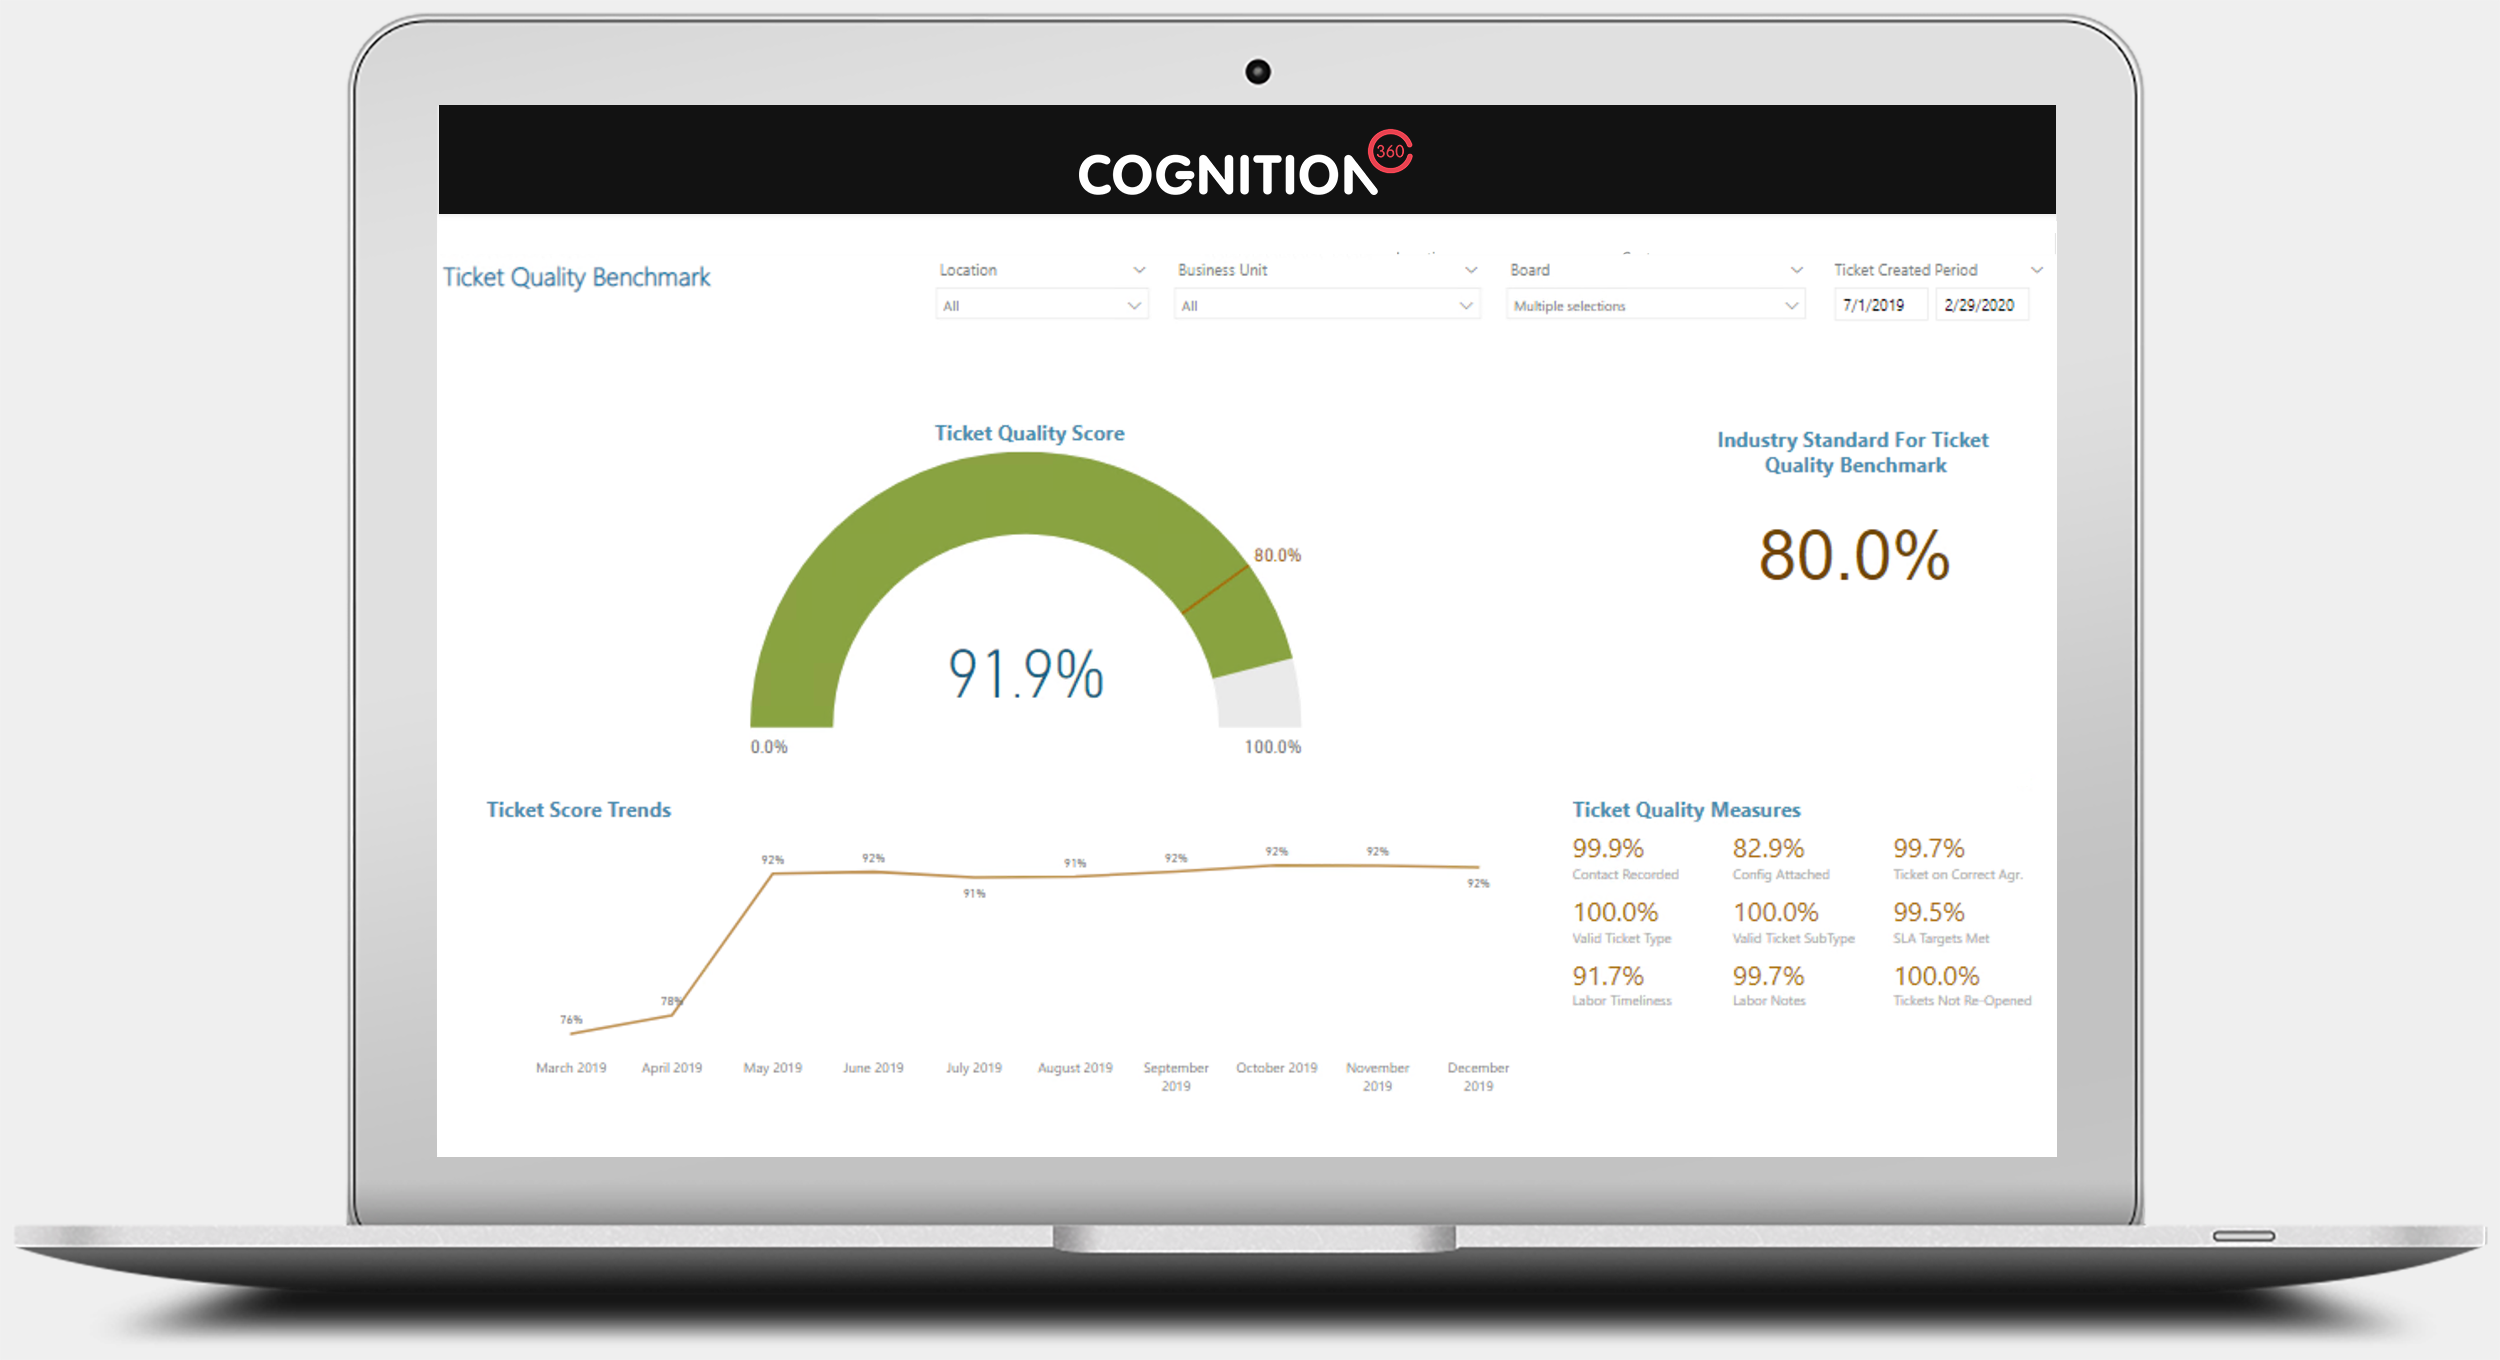
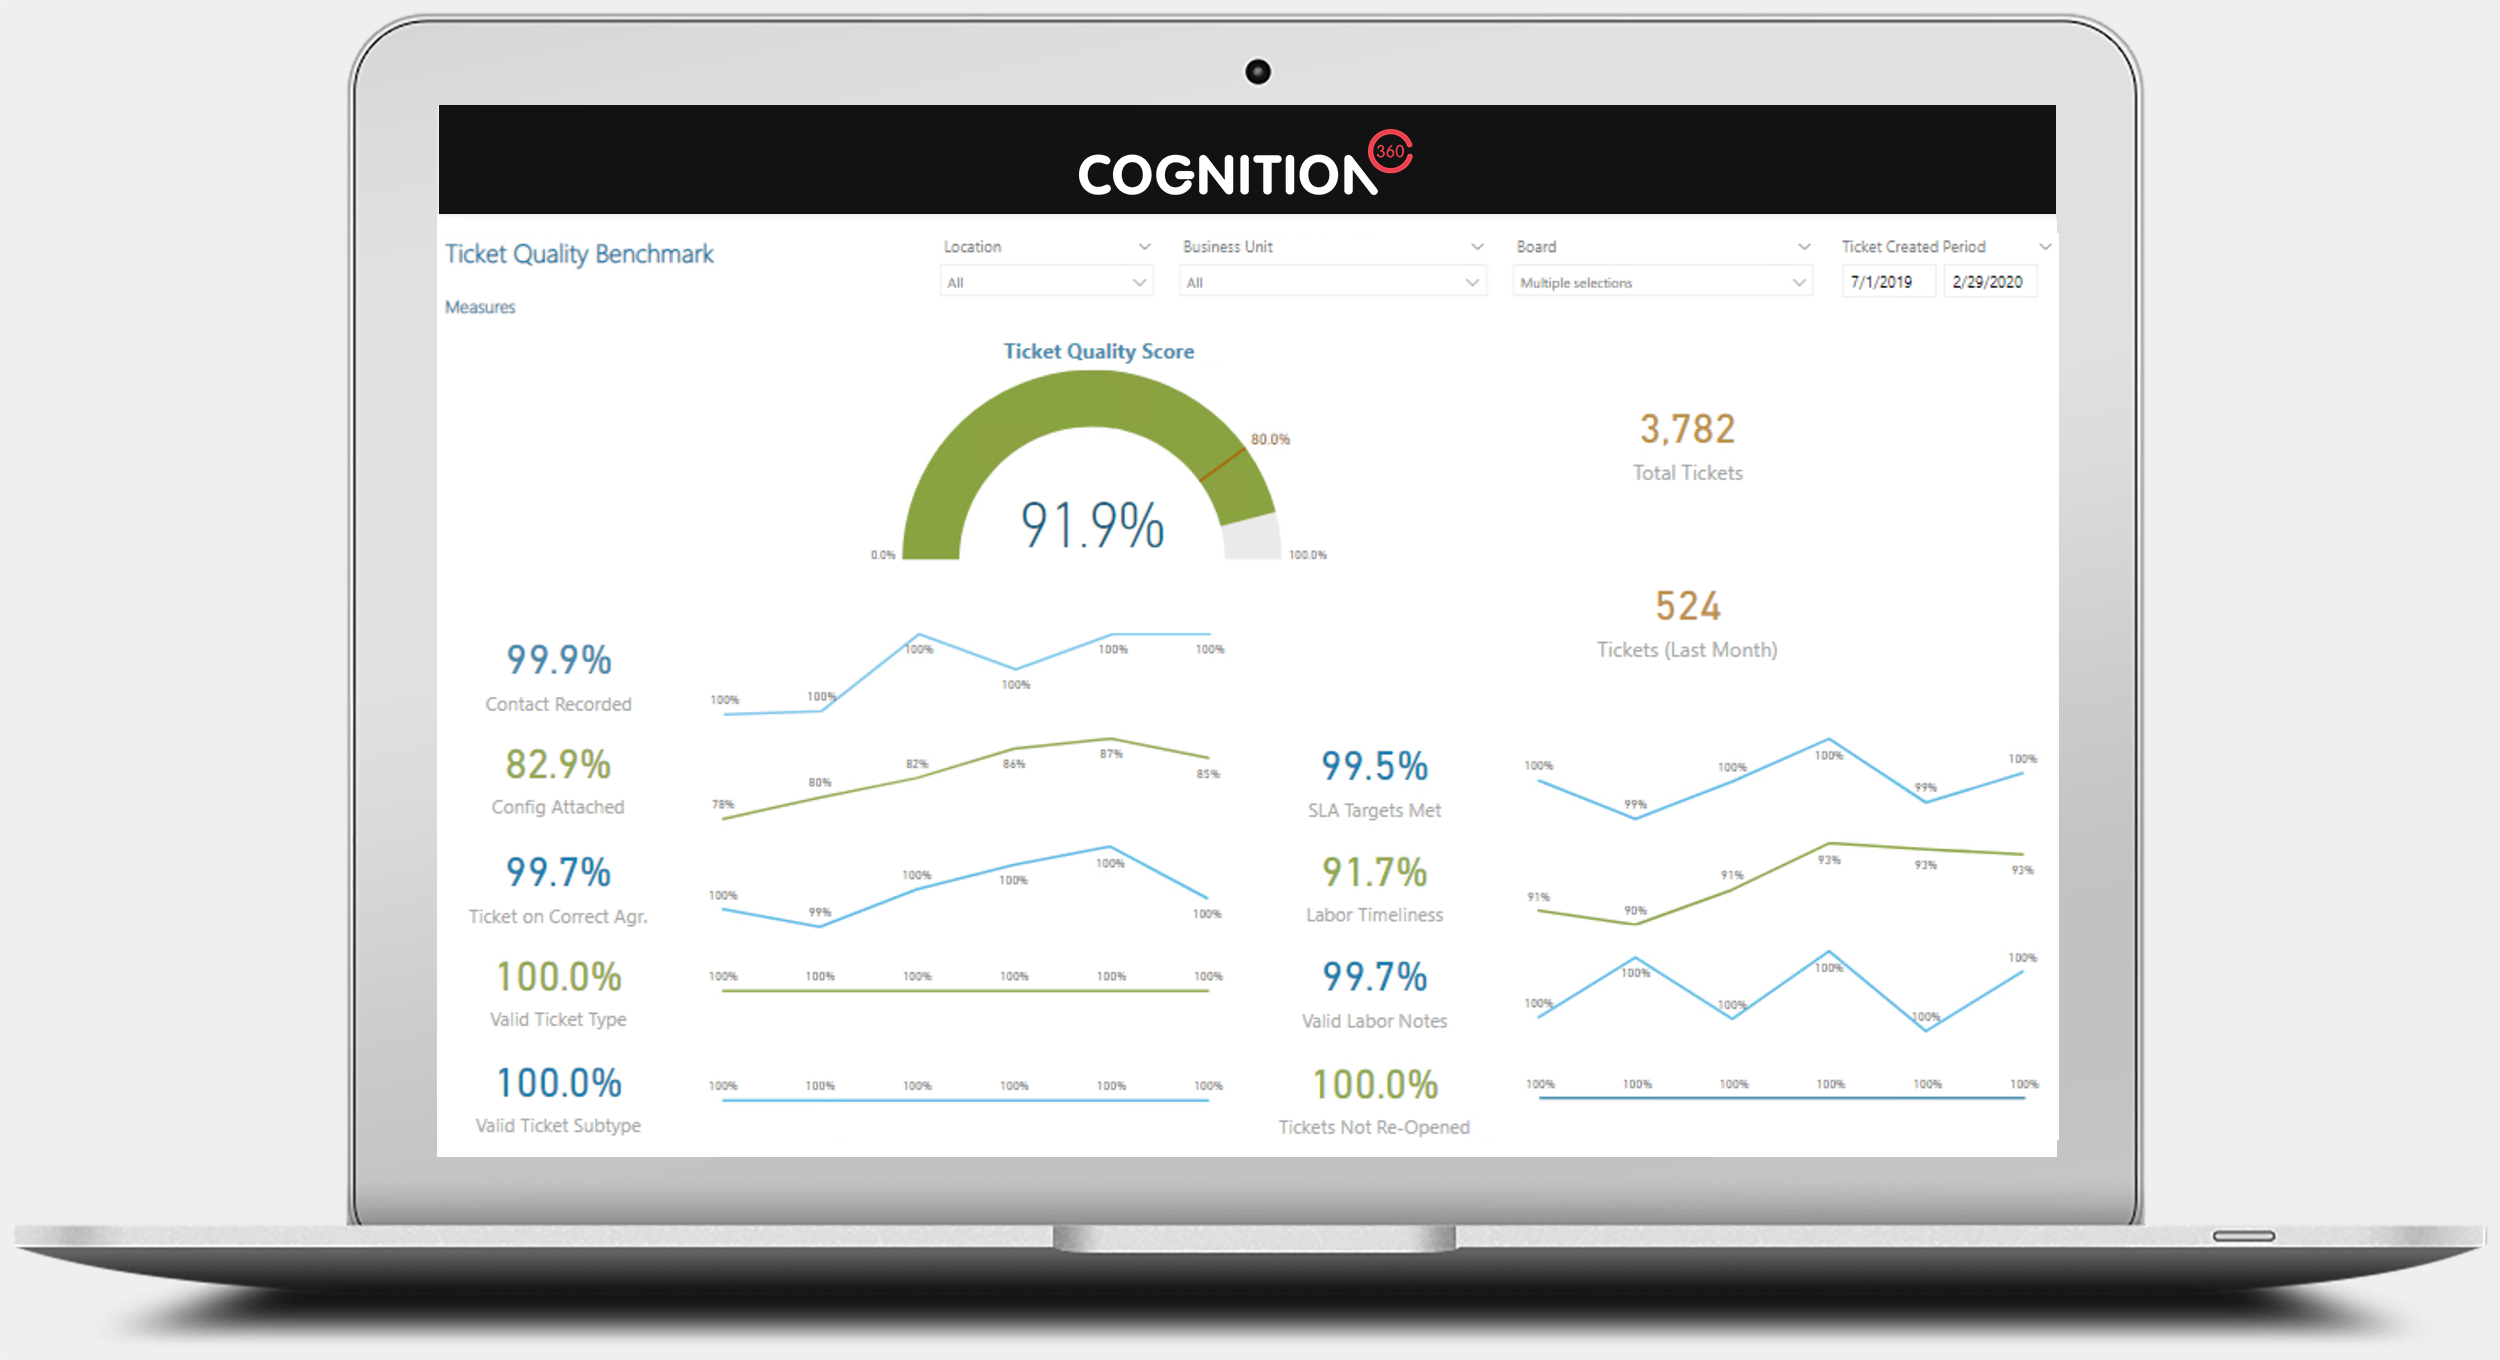
The Ticket Quality Benchmark report views show the benchmark value for Ticket Quality. This benchmark is a combination of nine measures on the ticket data across Type, Subtype, SLA, Configuration Attached, and so on. The Report Information page on the report details the measures included in the benchmark and how the overall score is calculated. (Number of report views shown: 2)
Customer Ratings Report Views
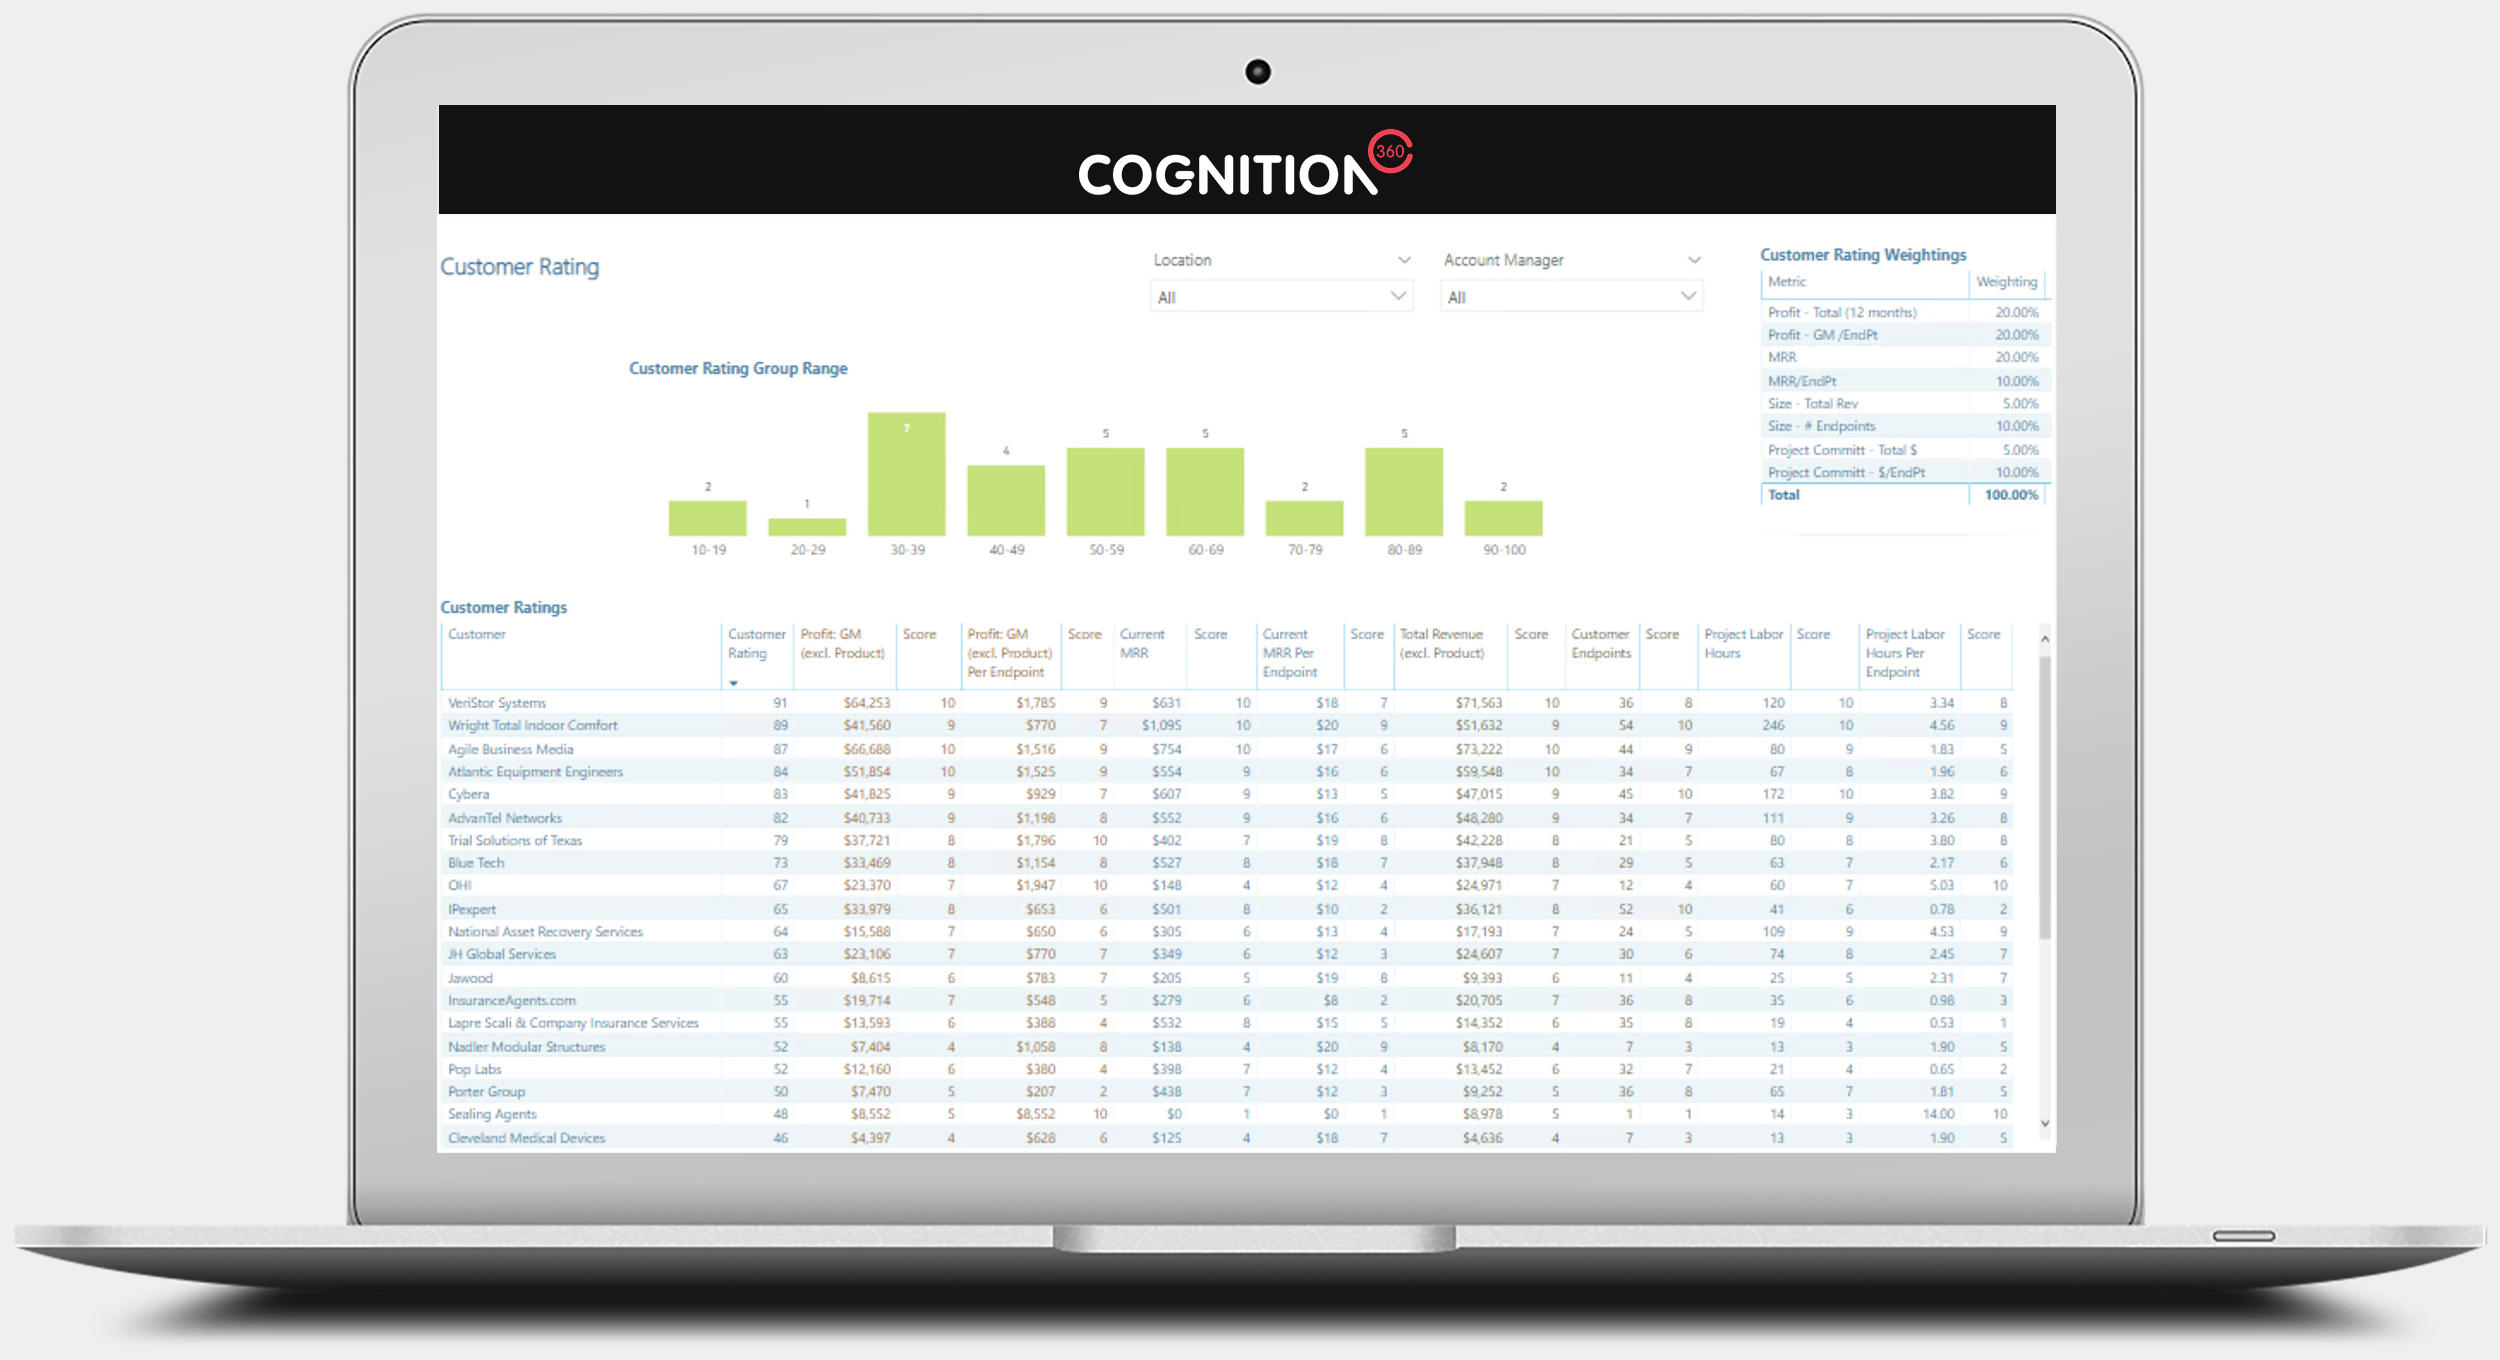
The Customer Ratings report view uses financial and project data to rate each customer across Gross Margin, Current MRR, Total Revenue and Project Labor. A score is applied to each metric, where the metric values are divided into groups of ten based on the split between top and bottom values. The weighting for each metric is applied to achieve the Customer Rating score. (Number of report views shown: 1)
Image too small? See full size image
Quarterly Business Review Report Views
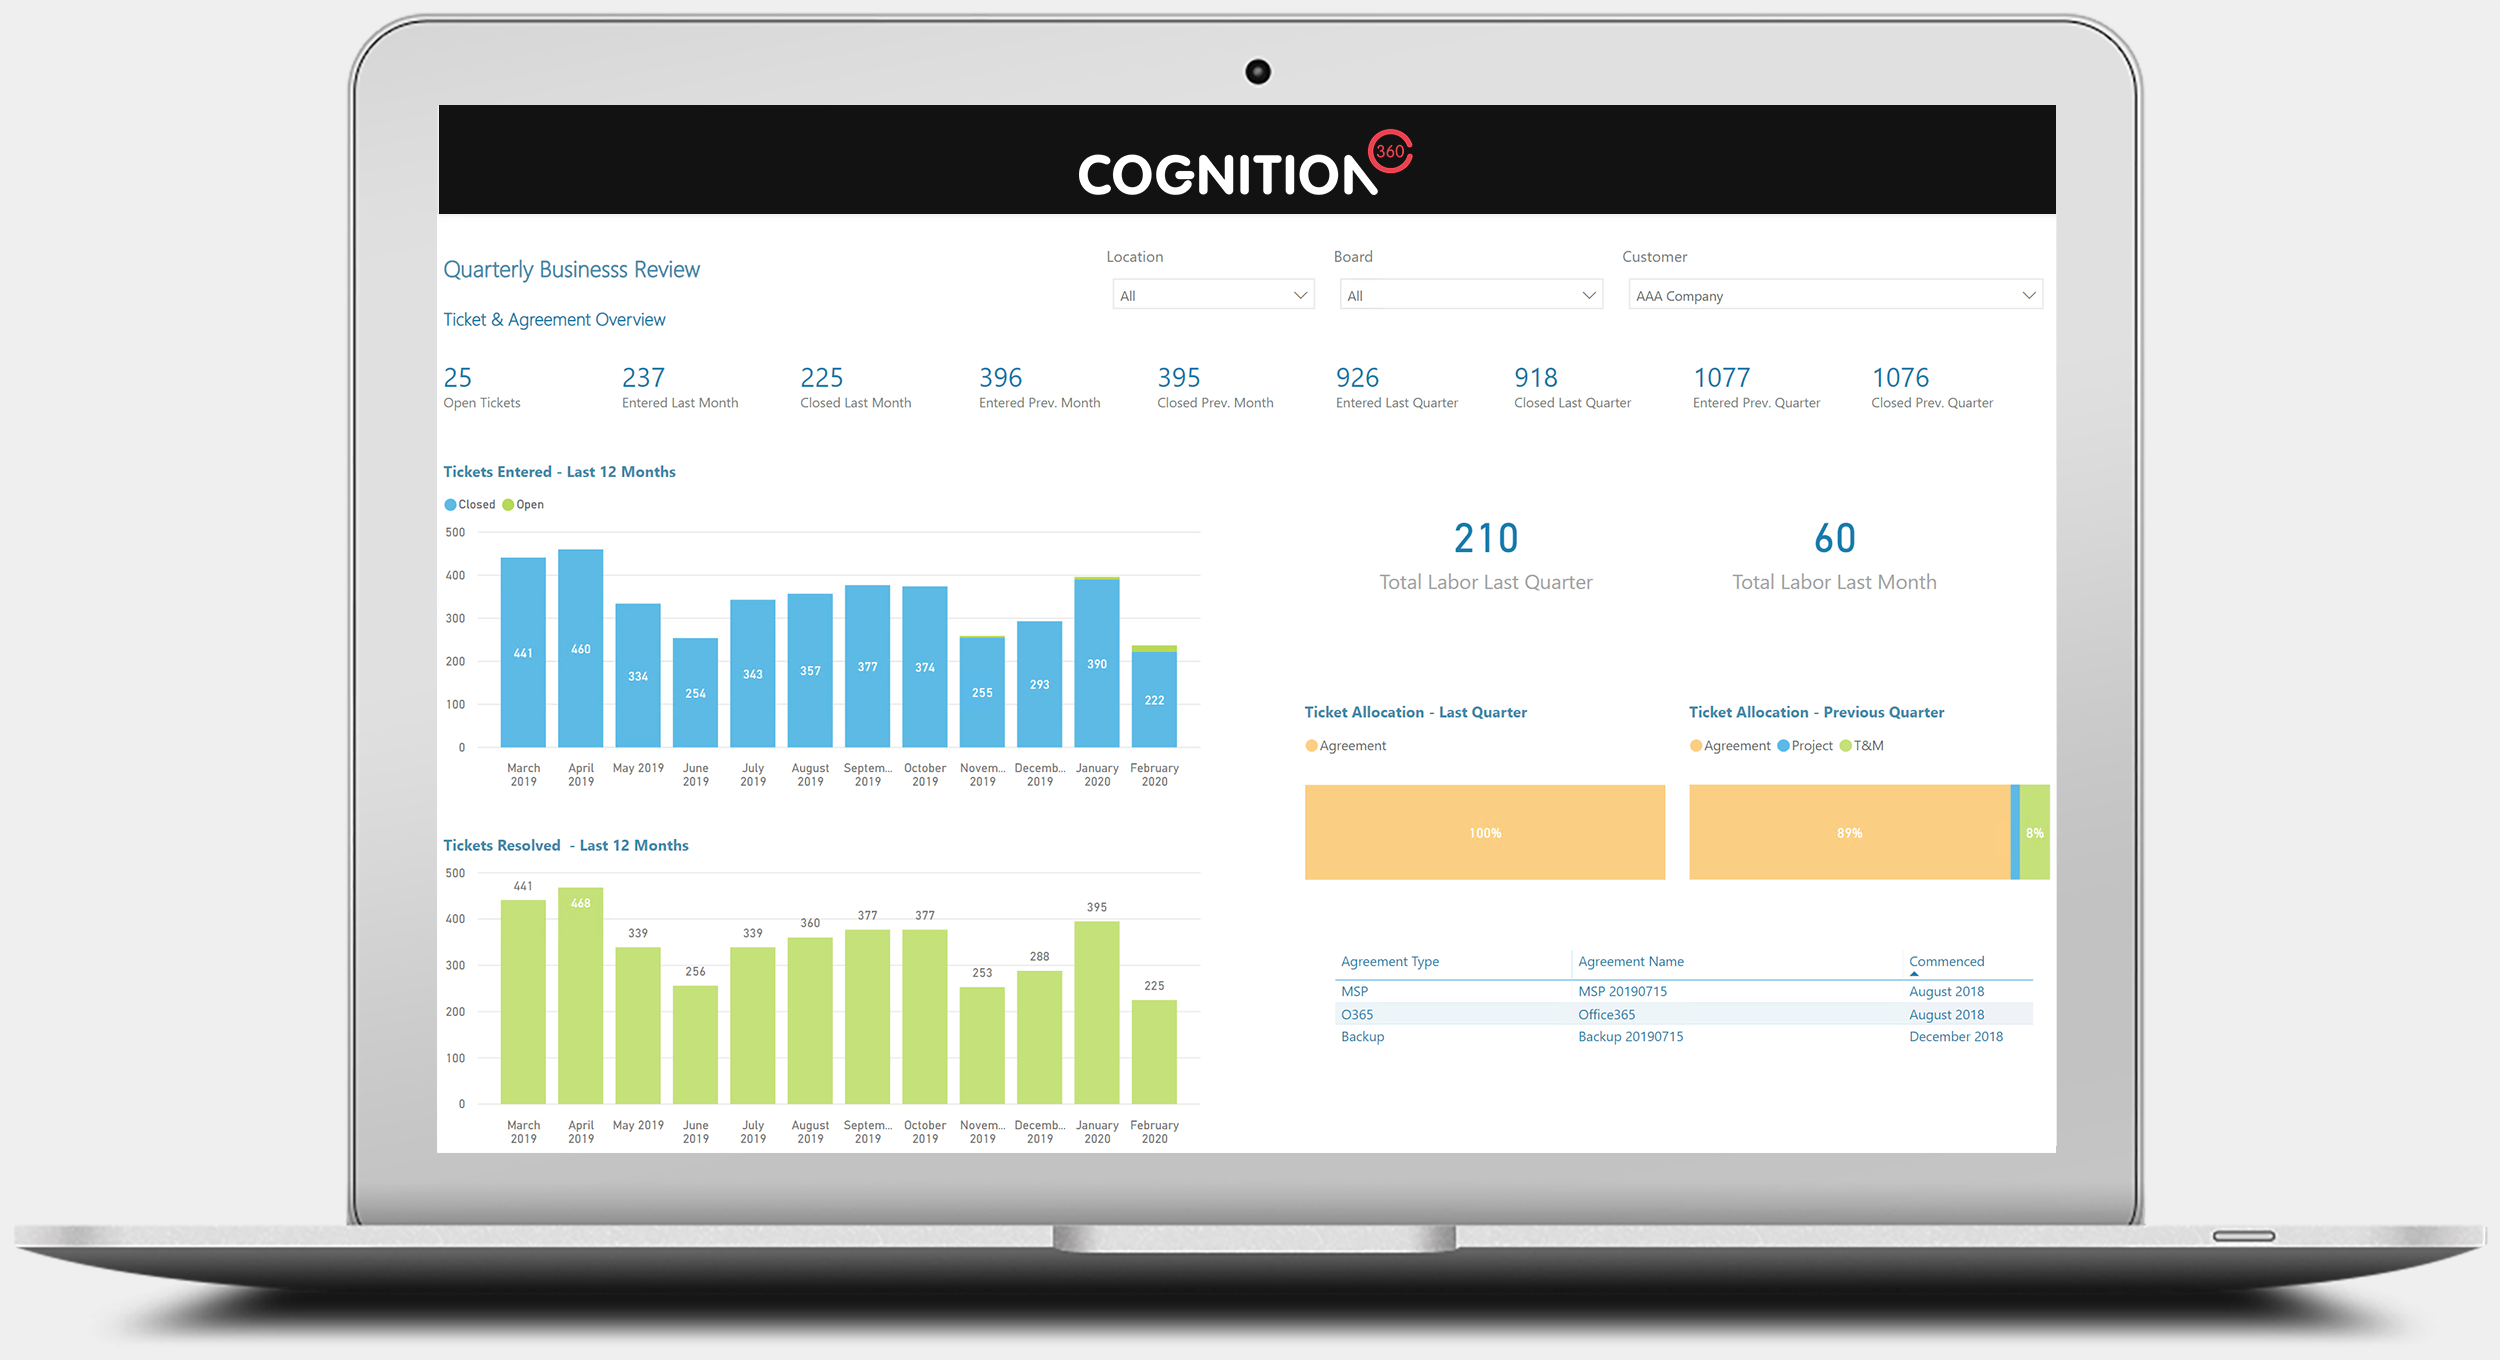
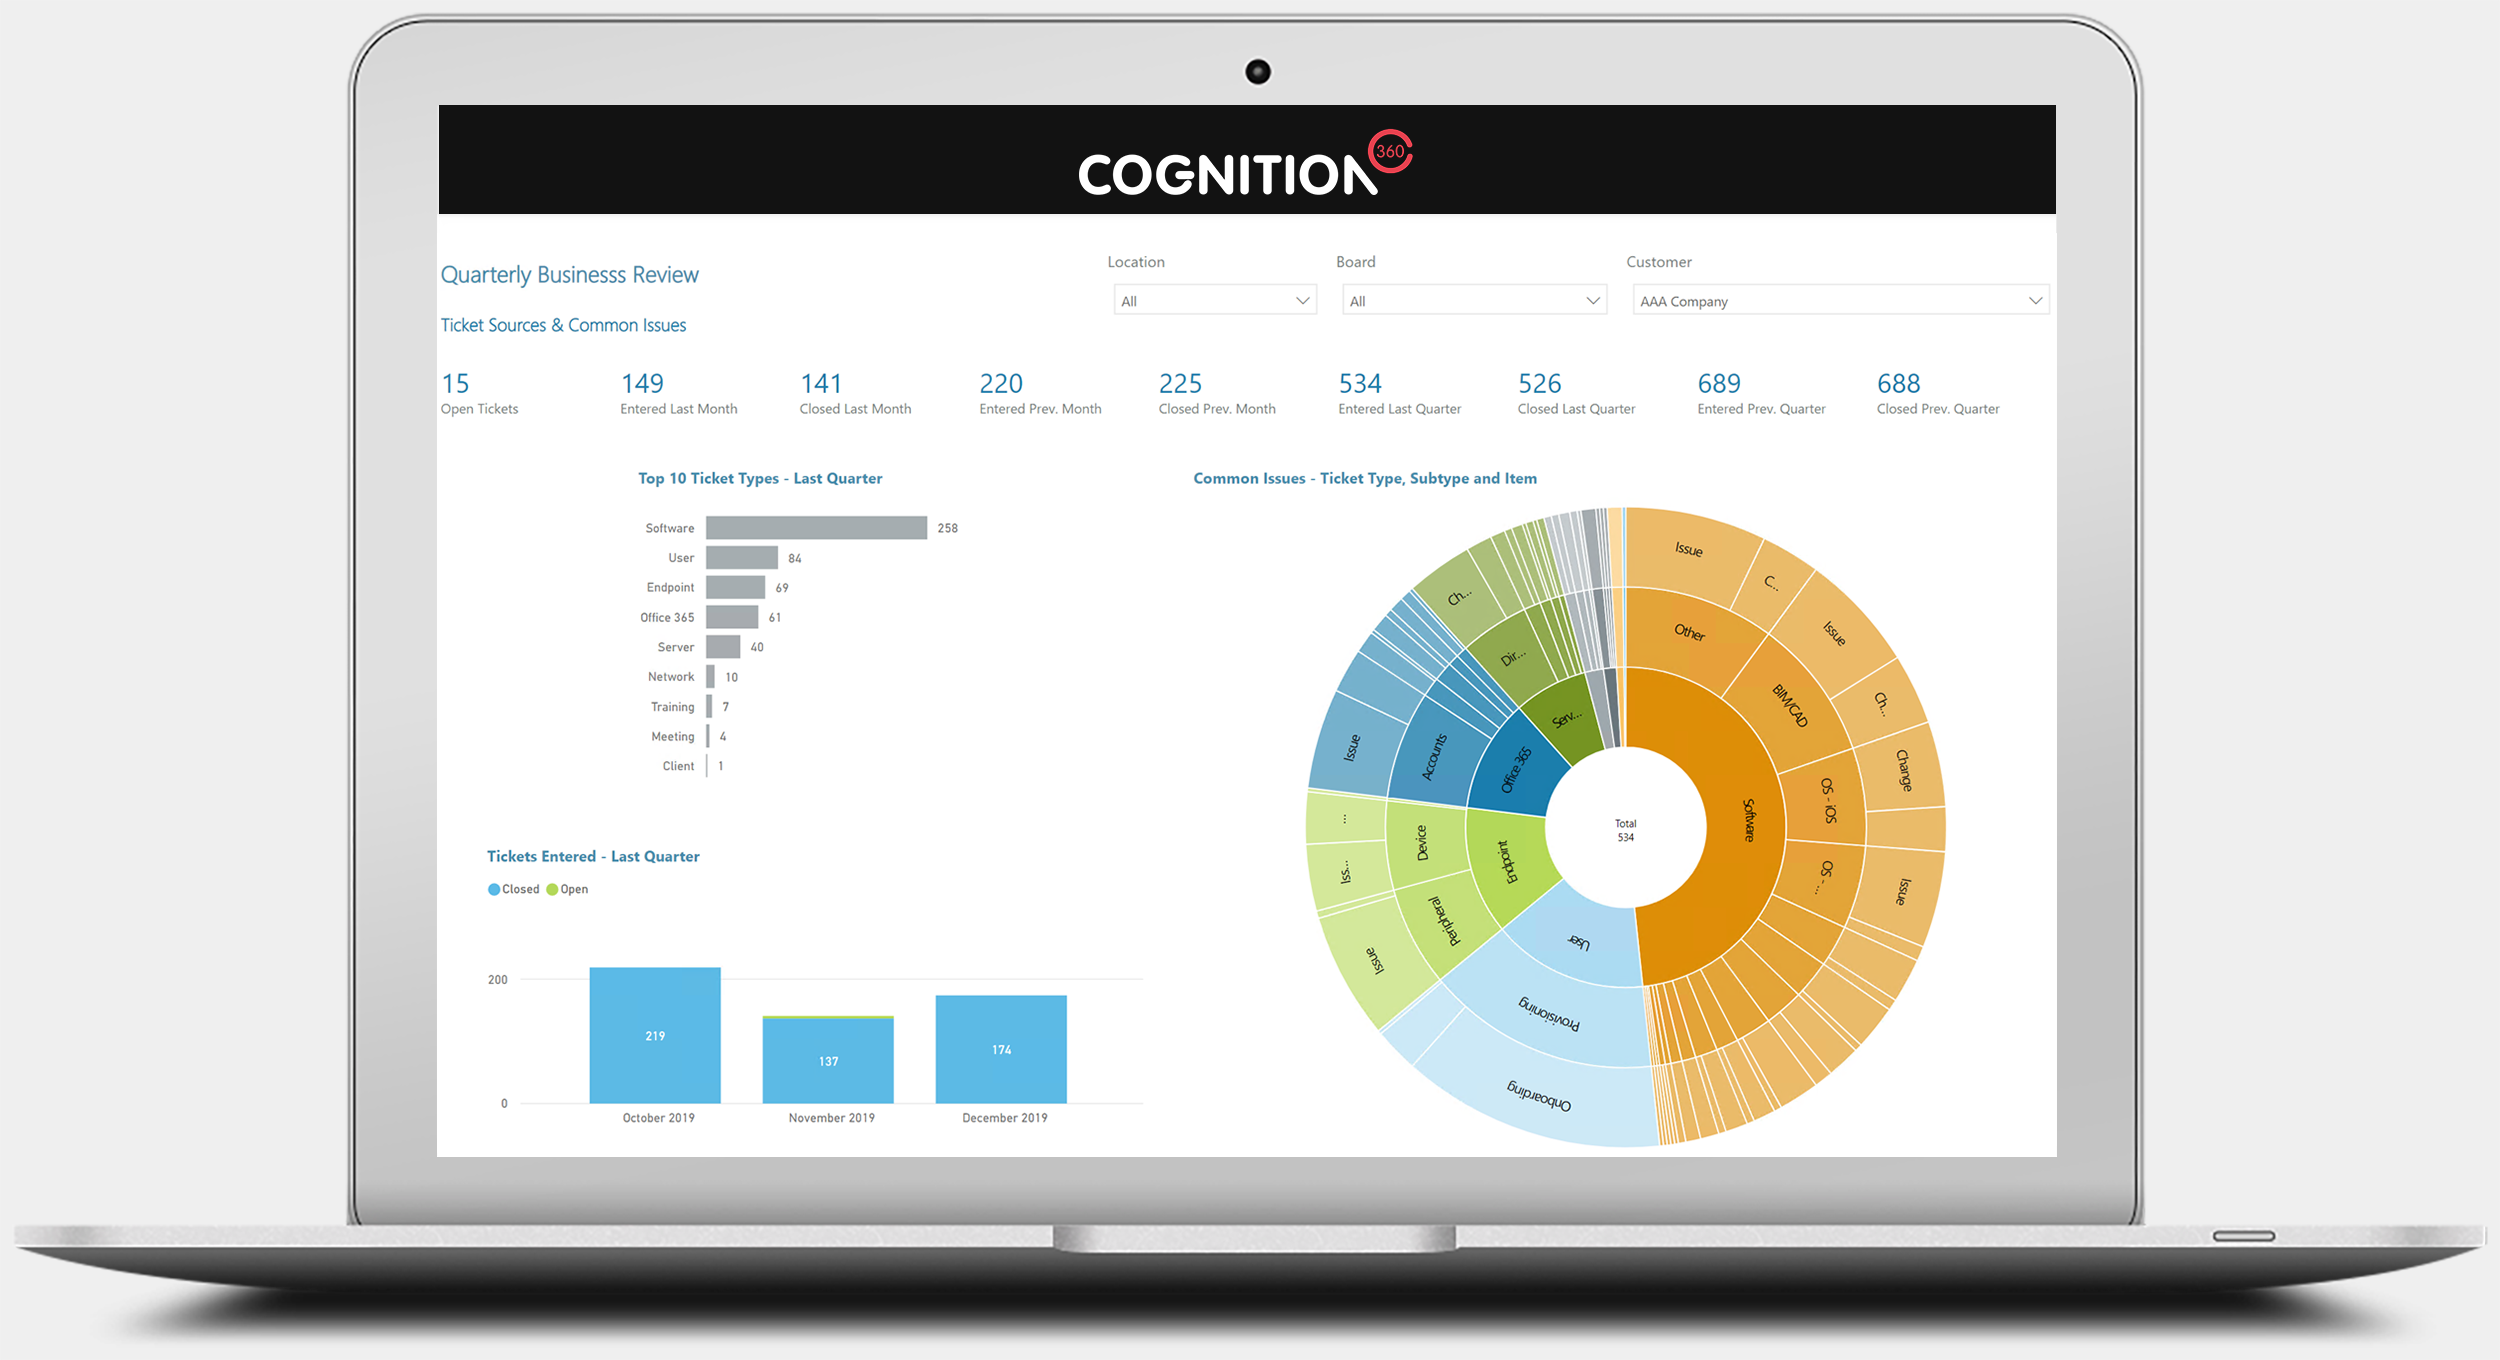
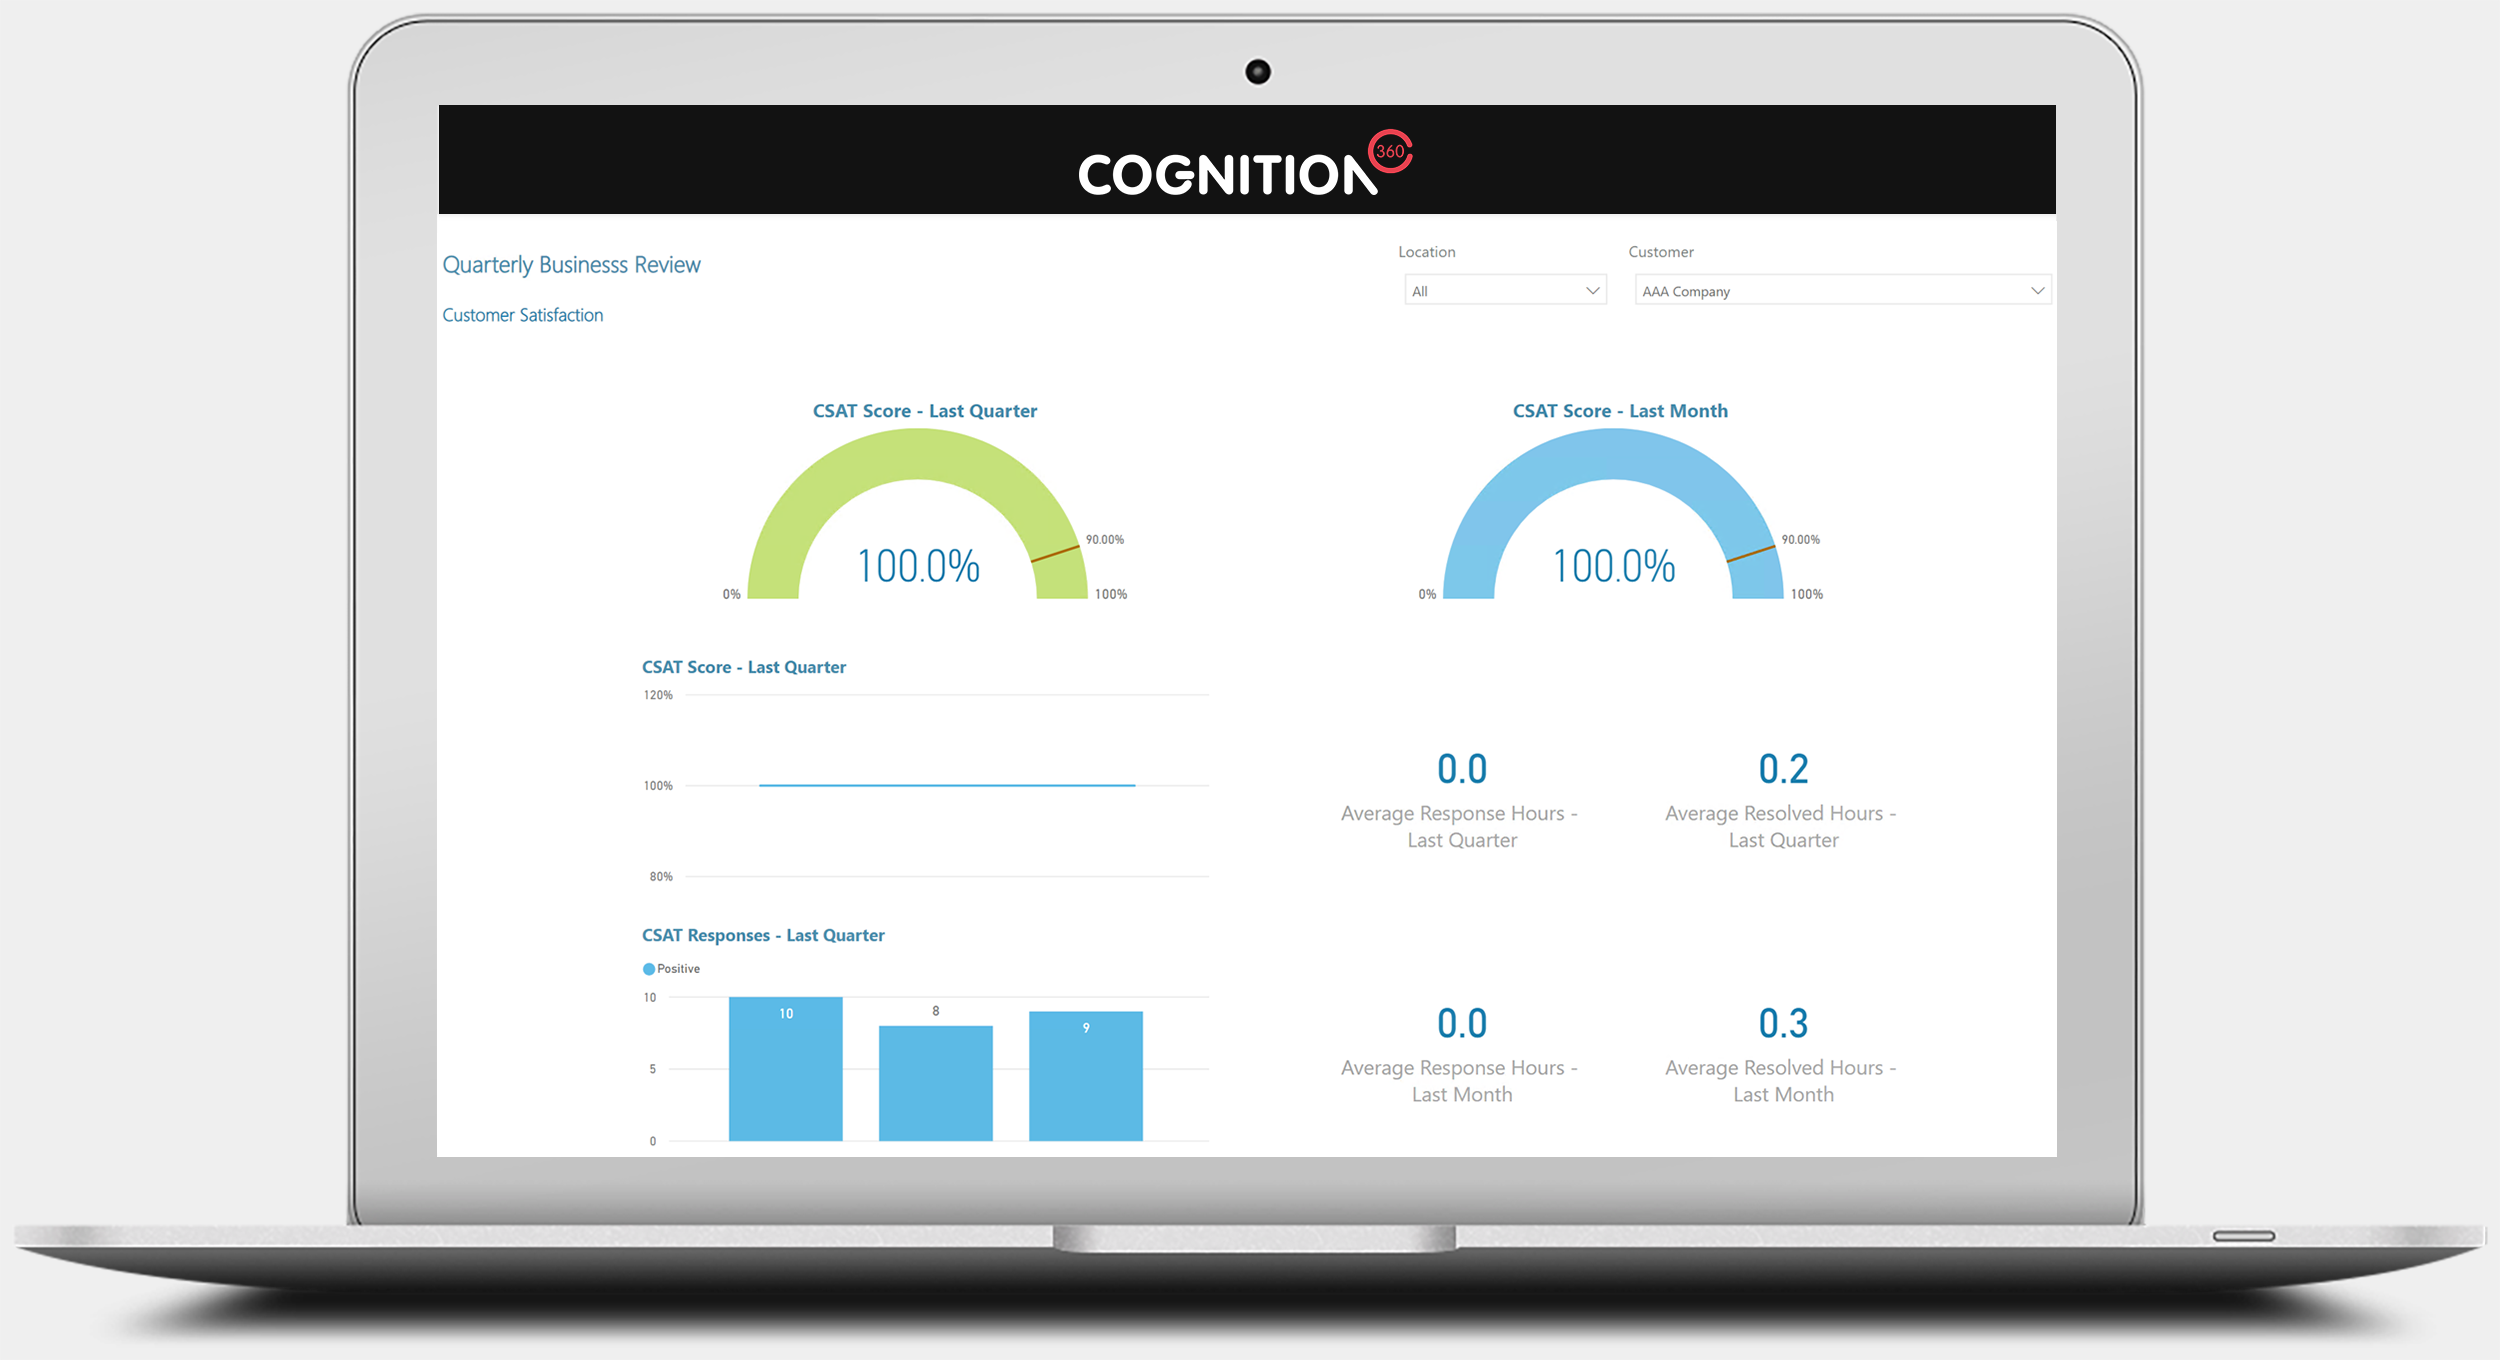
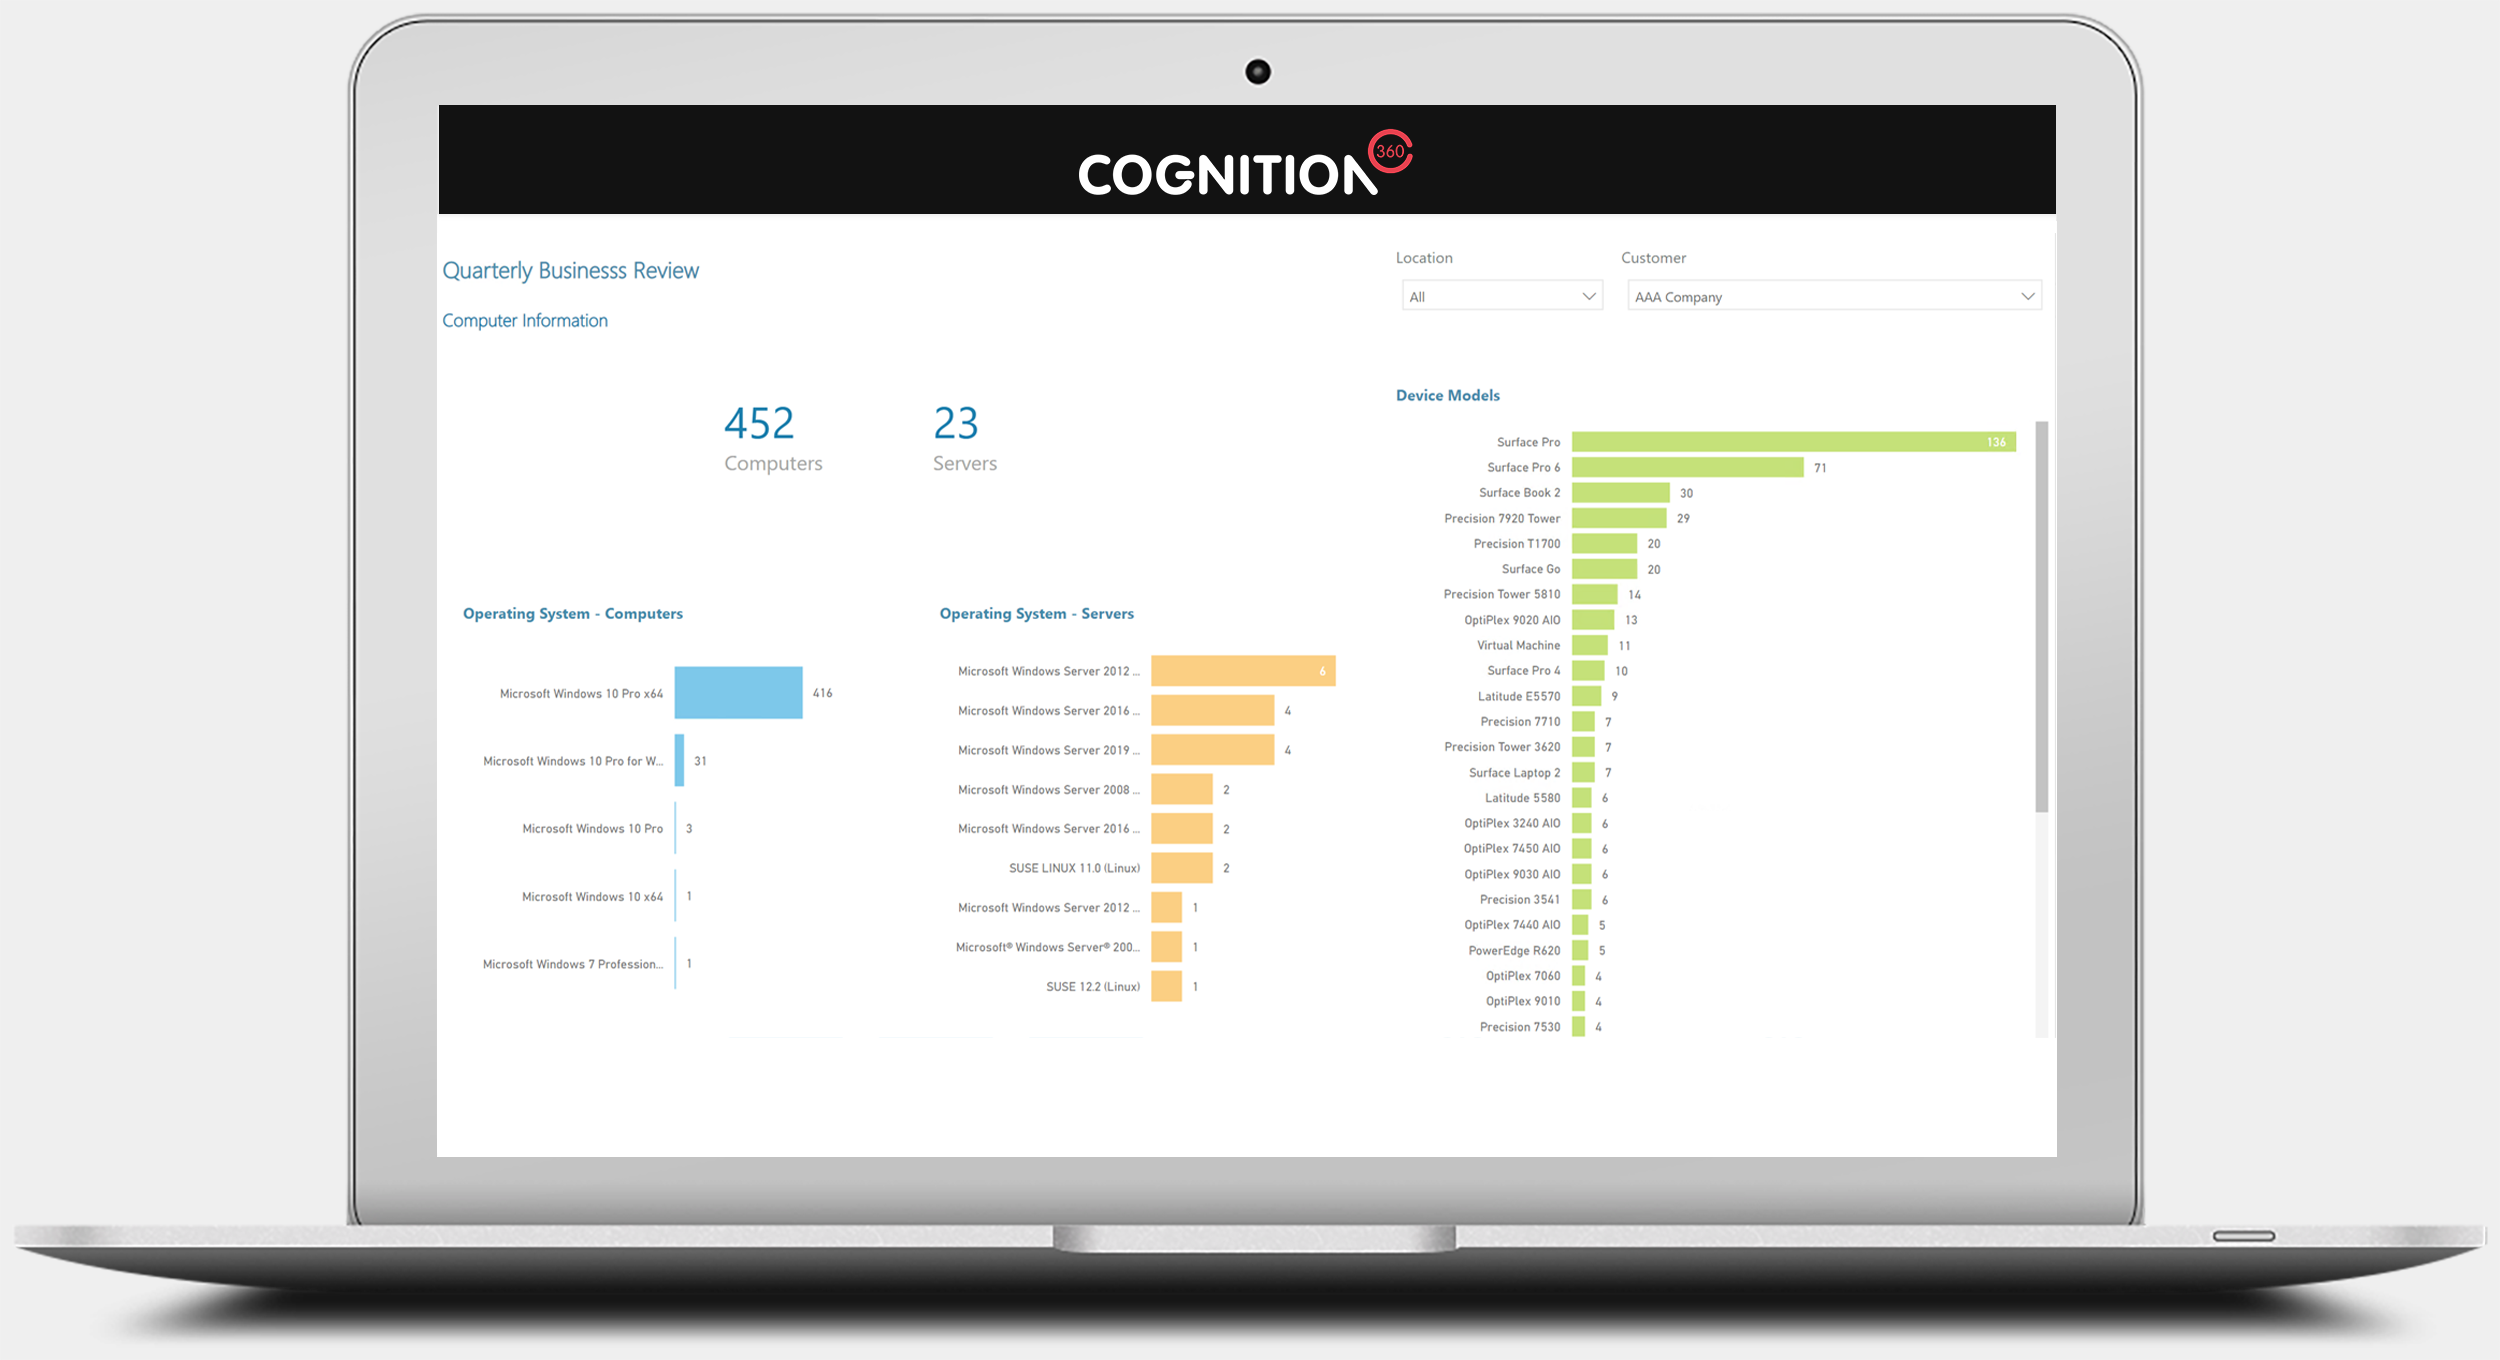
The Quarterly Business Review report views allow you to review customer ticket, labor, device and CSAT data as part of your QBR process. (Number of report views shown: 4. View A: Ticket & Agreement Overview; View B: Ticket Sources & Common Issues; View C: Customer Satisfaction; View D: Computer Information)
Common Issues Report Views
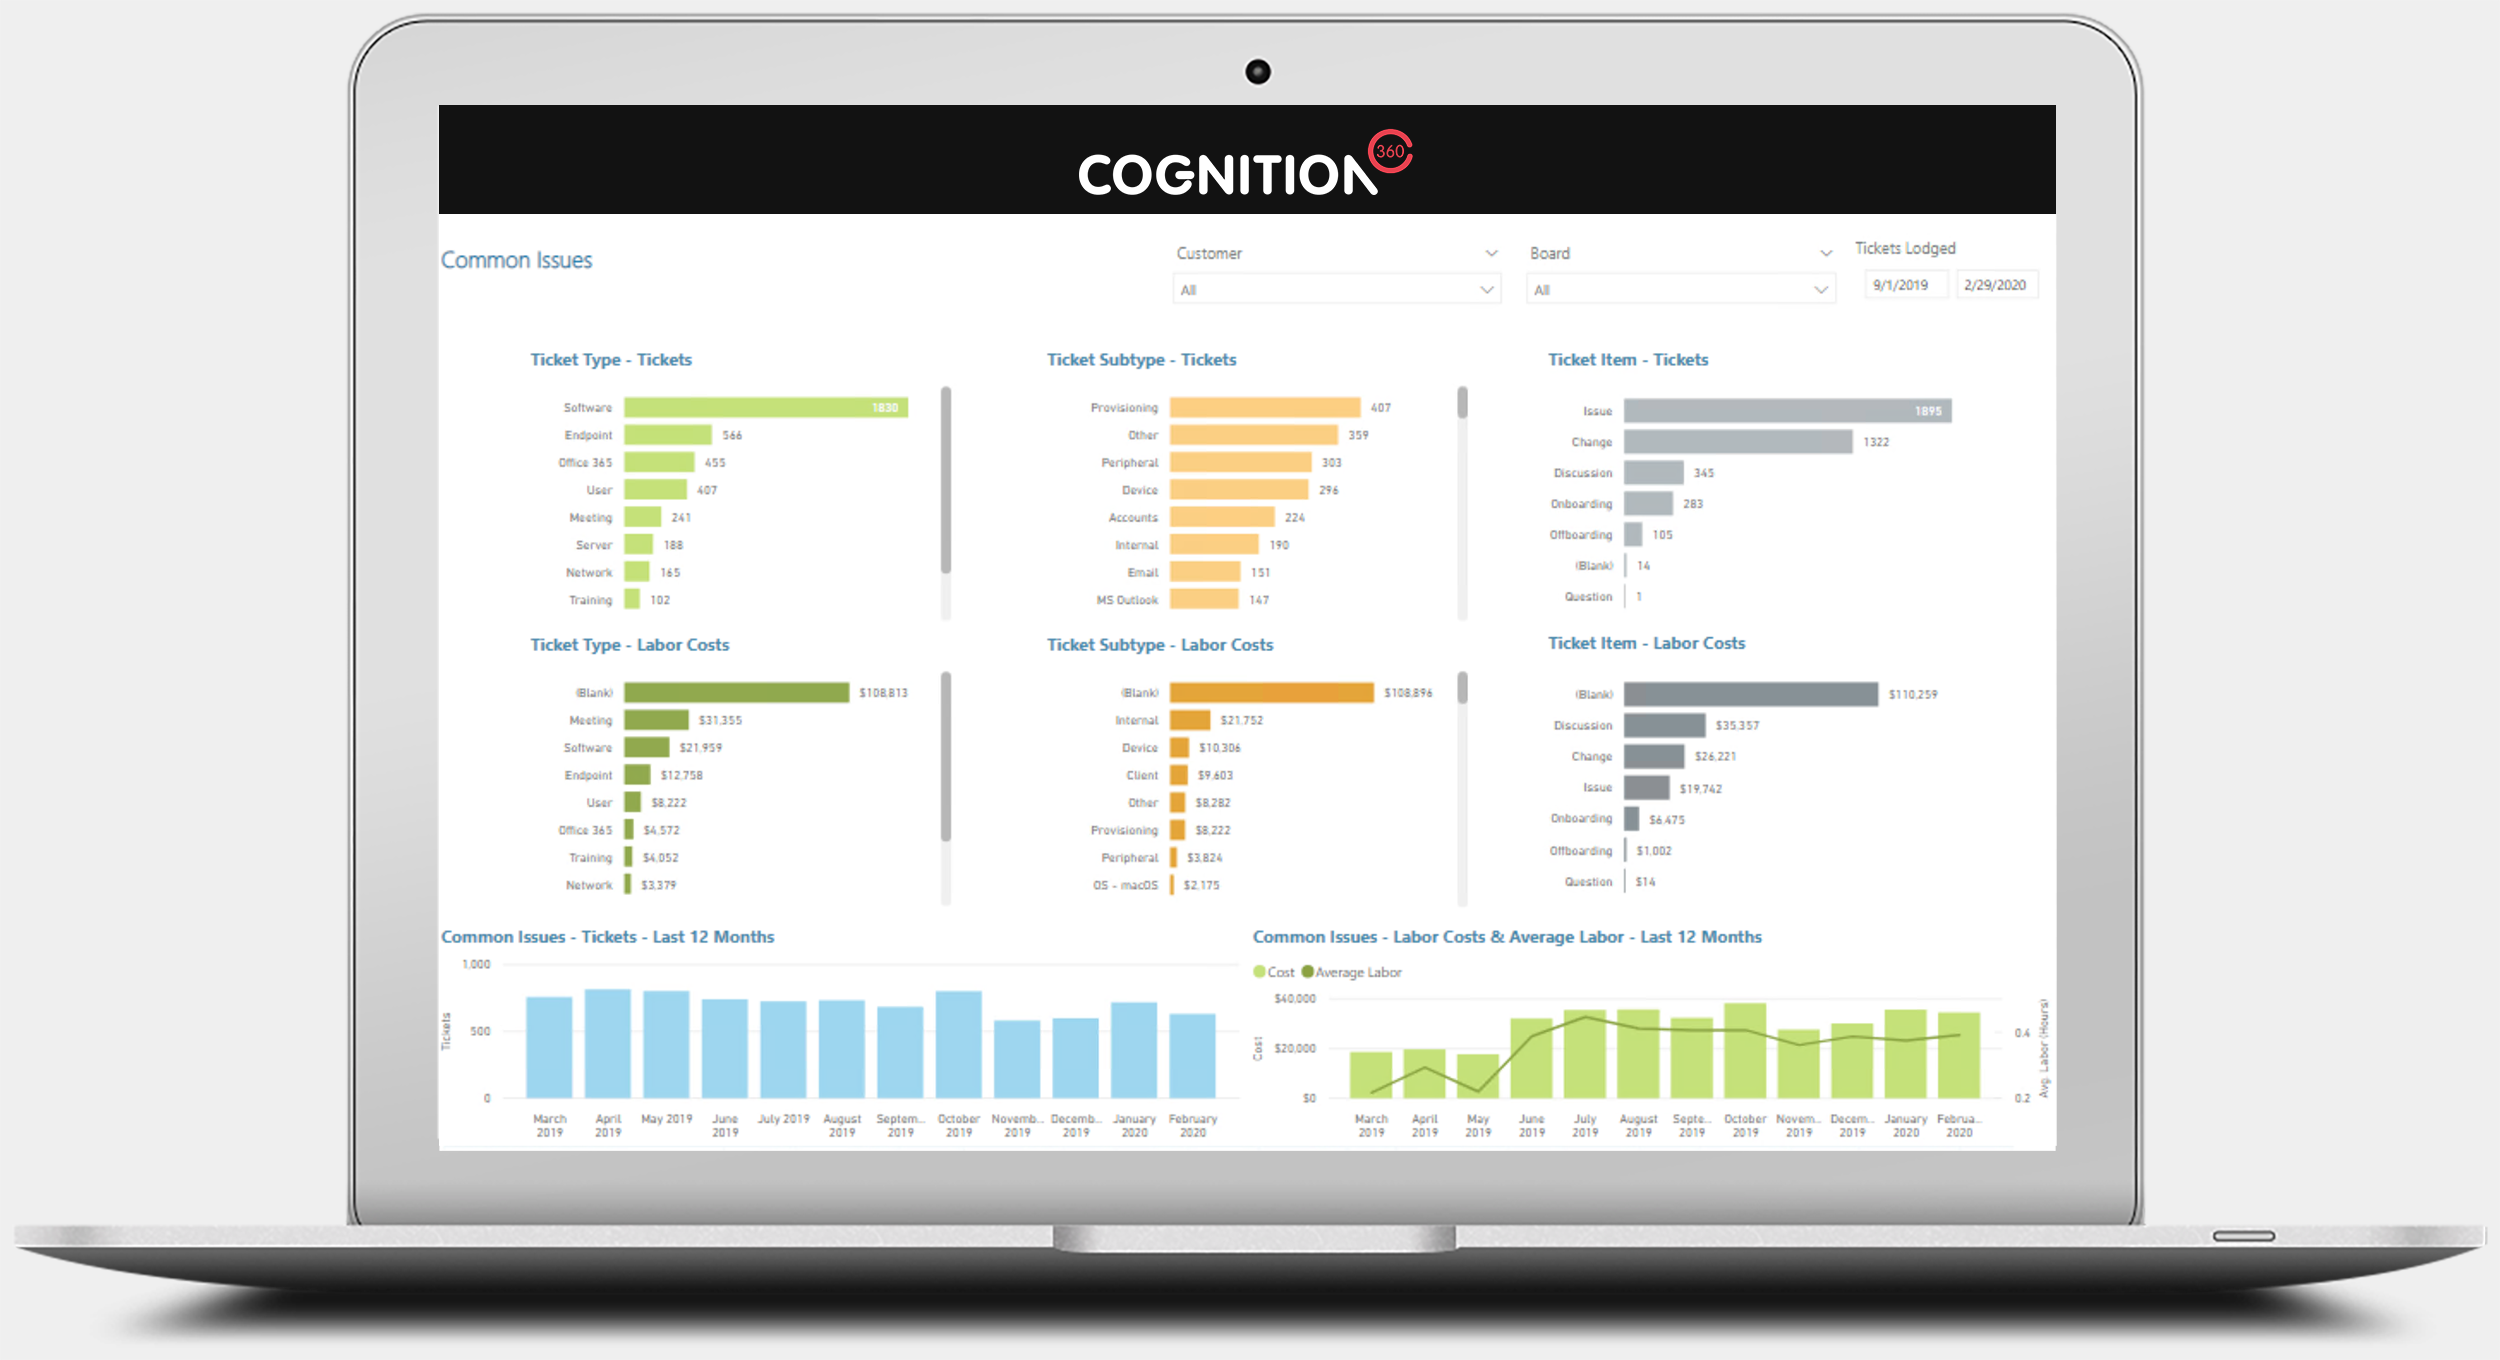
The Common Issues report views enable you to analyze common issues your organization is working on over a selected date range. Across Ticket Type, Sub-type and Item for tickets and labor (hours/Costs). Find out where the data gaps are and which issues are generating the most resource costs. (Number of report views shown: 1. )
Image too small? See full size image


